Join our fan page
- Published by:
-
Cristian David Castillo Arrieta
 Finance and International Business professional with a specialization in Financial Management. Self-taught MQL5 and Python developer focused on algorithmic trading, multi-asset portfolio construction, and quantitative risk management.
 - Views:
- 189
- Rating:
- Published:
-
 You are missing trading opportunities:
- Free trading apps
- Over 8,000 signals for copying
- Economic news for exploring financial markets
Registration Log inYou agree to website policy and terms of use
If you do not have an account, please register -
 Need a robot or indicator based on this code? Order it on Freelance
Go to Freelance
Need a robot or indicator based on this code? Order it on Freelance
Go to Freelance
Most traders judge a strategy's risk by a single number: its maximum drawdown. That figure tells you how far equity fell from its peak, but it says nothing about how often declines happen, how long the account stays below a previous peak, or how quickly it recovers. Two equity curves with the same maximum drawdown can be very different to hold.
DrawdownDNA is a script that reads a daily equity curve and dissects the full structure of its declines. It rebuilds the equity curve and its underwater curve, splits the underwater curve into individual drawdown episodes, and combines a set of risk metrics into a single resilience grade.
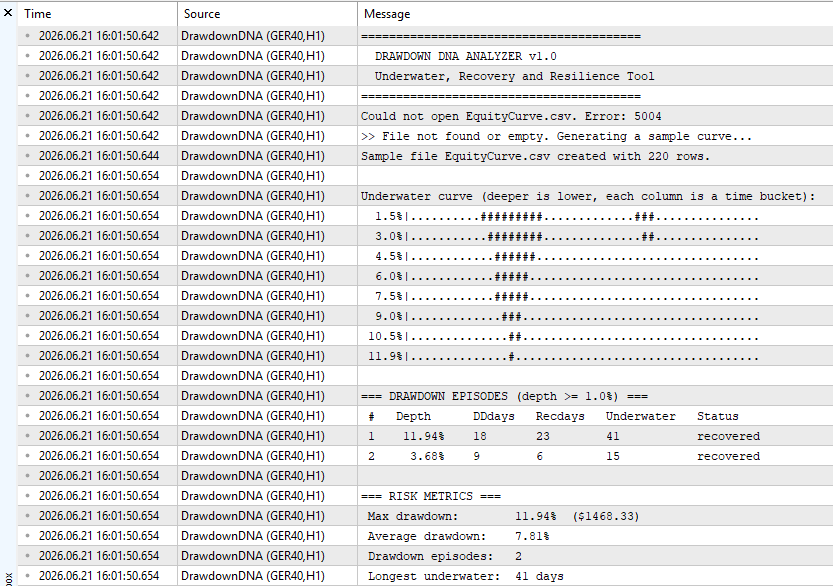
On each run it prints, in the Experts tab:
- A text underwater curve, so the shape of the declines is visible at a glance.
- A table of drawdown episodes with depth, drawdown duration, recovery time and underwater length.
- Maximum and average drawdown, number of episodes, longest underwater period and time underwater.
- The Ulcer Index, the Pain Index and the Recovery Factor.
- A composite resilience score (depth, recovery and stability), graded from A+ to F, with recommendations.
Input. The script reads a CSV file with two columns, Date and DailyPnL, one row per trading day. On the first run, if no file is found, it creates a sample EquityCurve.csv and analyzes it, so you can see the output immediately (the "file not found" message with error 5004 is expected on that first run). To analyze your own strategy, export its daily results to the same format; the included helper ExportEquity.mq5 writes that file from the trade history and can be called from an Expert Advisor's OnTester() event.
Parameters. InpFileName (the CSV file), InpStartCapital (starting capital used to rebuild the equity), InpMinDepthPct (ignore episodes shallower than this), and three weights InpWeightDepth, InpWeightRecov and InpWeightUlcer for the composite score.
 FVG Imbalance Marker Helper
A small educational MetaTrader 5 indicator that marks simple three-candle bullish and bearish Fair Value Gaps on the chart.
Confirmed Swing Points Helper
A small educational MetaTrader 5 indicator that marks confirmed swing highs and lows and labels market structure as HH, HL, LH and LL.
 Profit Concentration Analyzer
A native MQL5 script that measures how concentrated a strategy's profit is — whether the edge is broad or rests on a few lucky trades. It reads a per-trade CSV (Date,Profit) and reports the share of net profit from the largest trades, the Gini coefficient of the winners, a concentration profile, a survival test that removes the best few trades and recomputes net profit and profit factor, and the largest single day versus a configurable consistency limit, combined into a concentration-and-consistency score (A+ to F) with recommendations. If no file is found it generates a sample set, so it runs out of the box. No external libraries, no Python, no AI. The helper ExportTrades.mq5 writes the file from your trade history.
MACD Signals
Indicator edition for new platform.