

Building an Internal and External Market Structure Indicator
 5 409
5 409
 0
0

Introduction
Price charts in MetaTrader 5 display candles and basic indicators, but they do not explicitly expose market structure elements such as validated swing highs and lows, external trend formation, and the first meaningful internal shift (Break of Structure or Change of Character) within that trend. As a result, manual identification is slow, subjective, and difficult to reproduce, while poorly defined rules in code can lead to duplicate signals and inconsistent structure detection.
This article presents a focused, rule-based MQL5 implementation that automates the detection and visualization of external and internal market structure and converts the first valid internal shift into a fully defined trade setup. The indicator identifies S1→S4 swings using explicit IsSwingHigh() and IsSwingLow() routines, refines the true extremes between those anchor points, validates the external bullish or bearish sequence, and then searches inside that confirmed range for the first IH→IL→CHoCH sequence. The result is a reproducible and debuggable indicator that draws structure lines and labels, creates an entry marker, places the stop loss at the internal low, and projects take profit at 1.5× risk.
Project Overview and Implementation Plan
Understanding the structure and behavior of the internal and external market structure indicator is essential before beginning the implementation phase. Determining the function of each component and streamlining the development process are made easier by fully understanding the project's objective.
What We Are Building
We will develop an internal and external market structure indicator for MetaTrader 5 in this article. This indicator will automatically identify important structural points in price movement and show them on the chart. To identify swing highs and swing lows, which serve as the basis for identifying both internal and external market structures, the indicator examines past price data. A candle is said to have a swing high if its high exceeds the highs of a predetermined number of candles that came before and after it. This demonstrates that the price has reached a local market top. Comparably, a swing low is a candle that confirms a local market bottom by having a low that is lower than the lows of a certain number of candles before and after it. Instead of capturing arbitrary price swings, this approach guarantees that only significant turning points are recorded.
To identify the external structure, we use a larger swing lookback period. This means we compare each potential swing point against more candles before and after it. The purpose of using more bars is to filter out minor price movements and focus only on major market swings that define the overall trend. These major swings are then used to determine the external high and external low, which represent the dominant structure of the market. In contrast, the internal structure uses a smaller swing lookback period. Fewer candles are used when identifying internal swings so that smaller and more sensitive price movements can be captured. This allows the indicator to detect break of structure and change of character events earlier within the trend. The external structure shows the overall market direction. Internal structure captures short-term momentum shifts within that trend.
The indicator shows a swing low, swing high, higher low, and higher high for a bullish external structure. The External High (EXH) represents the higher high, while the External Low (EXL) represents the higher low.
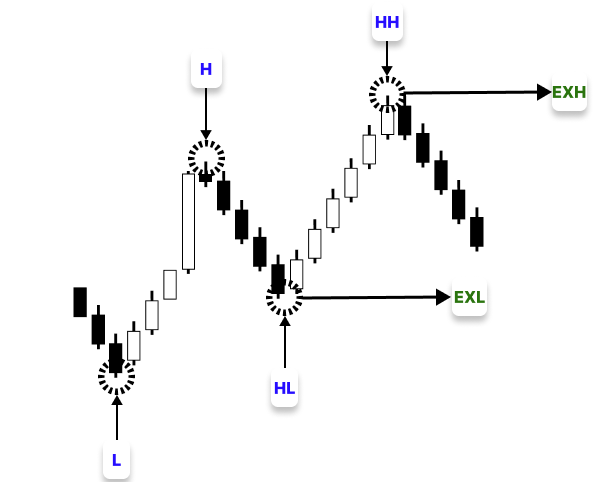
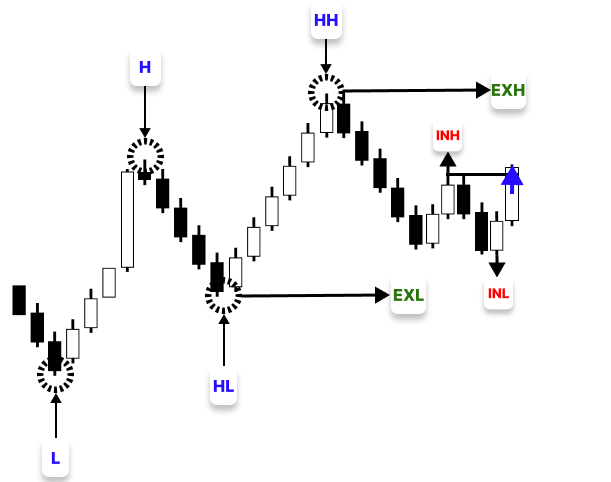
The indicator looks for the first internal structural shift inside that trend after the external structure has been established. When price breaks above the Internal High (INH) after creating an Internal Low (INL), it indicates a possible change in short-term momentum within the larger bullish trend. This is the first bullish break of structure or change of character in a bullish external structure.
The indicator shows a swing high, swing low, lower high, and lower low for a bearish external structure. The lower low becomes the External Low (EXL), and the lower high becomes the External High (EXH). The indicator looks for the first internal structural change inside that trend once the external structure has been established. In a bearish external structure, it looks for the first bearish break of structure or change of character, where price breaks below the Internal Low (INL) after forming an Internal High (INH), signaling a potential shift in short-term momentum within the broader bearish trend and possible continuation of the bearish structure.
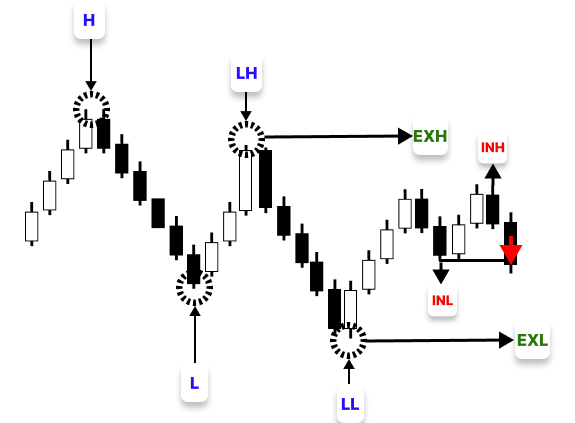
Ultimately, trend lines, labels, and signal markers are used to visualize all identified structures on the chart, making the market structure easily comprehensible for both algorithmic strategy formulation and manual examination.
Note: To avoid repetition, we will explain the detection process using the bullish case only, since the bearish structure follows a very similar logic with inverted conditions. The same principles used to identify swing highs, swing lows, and structural shifts can also be applied in reverse when analyzing a bearish market structure.
Implementation Plan
The indicator will be implemented according to the following pipeline:
- External Structure Construction, Refinement, and Validation (EXH/EXL)
- First Internal Structure Detection with External Validation Control
- Visualization and Trade Setup Generation with Object Handling
Note: The project discussed in this article is entirely project-based and intended to teach readers MQL5 through real-world, hands-on application. It is not a guaranteed method for making profits in live trading.
Implementation in MQL5
In this section, we will move from theory to practical implementation by translating the concepts discussed earlier into MQL5 code. We will implement each component of the indicator step by step, including swing detection, external structure identification, internal structure analysis, and trade setup generation.
External Structure Construction, Refinement, and Validation (EXH/EXL)
As stated in the implementation plan, the first step is to identify the swing highs and swing lows that will serve as the foundation for creating the external market structure. Before performing this analysis, we must ensure that enough historical bars are available. Swing detection requires candles both before and after the candidate swing point.
Example:
#property indicator_chart_window
#property indicator_buffers 0
#property indicator_plots   0
#define OBJ_PREFIX      "EISM_"  // Prefix for all chart objects

int look_back     = 1000;              // number of candles to scan for pattern detection
int EX_SwingLookback = 15;             // swing validation range (left and right candles)
datetime lastTradeBarTime = 0;        // ensures logic runs once per new bar

//+------------------------------------------------------------------+
//| Custom indicator initialization function                         |
//+------------------------------------------------------------------+
int OnInit()
  {
//--- indicator buffers mapping

//---
   return(INIT_SUCCEEDED);
  }
//+------------------------------------------------------------------+
//| Custom indicator iteration function                              |
//+------------------------------------------------------------------+
int OnCalculate(const int32_t rates_total,
                const int32_t prev_calculated,
                const datetime &time[],
                const double &open[],
                const double &high[],
                const double &low[],
                const double &close[],
                const long &tick_volume[],
                const long &volume[],
                const int32_t &spread[])
  {
//---
//--- Skip processing if not enough bars are available
   if(rates_total < look_back + EX_SwingLookback)
      return 0;

//--- Get the time of the current (latest) candle
   datetime currentBarTime = iTime(_Symbol, PERIOD_CURRENT, 0);

//--- Only execute logic once per new candle to avoid redundant processing
   if(currentBarTime != lastTradeBarTime)
     {

      lastTradeBarTime = currentBarTime; // update last processed bar time to prevent re-running on same candle
     }

//--- return value of prev_calculated for next call
   return(rates_total);
  }
//+------------------------------------------------------------------+
Explanation:
All visual outputs, including trend lines, labels, and trade markers, will be generated on the candlestick chart itself since the indicator is set up to appear directly on the primary price chart using #property indicator_chart_window. Since the indicator does not employ conventional buffer-based charting techniques, indicator_buffers and indicator_plots are both set to 0. Rather, its representation is solely dependent on chart items. To guarantee that each object generated by the indicator can be readily recognized, controlled, and eliminated as required, a special object prefix, EISM_, is also defined.
The primary control variables specify how market data is analyzed by the indicator. To guarantee that the indicator concentrates on a particular segment of past price activity, the look_back parameter establishes how many candles will be checked for pattern discovery. Because it is utilized for external structure recognition, where the objective is to record only significant swing highs and swing lows, the EX_SwingLookback is set to 15. A value of 15 ensures that each potential swing point is validated using 15 candles on both the left and right sides, filtering out minor fluctuations and allowing only significant market movements to define the external structure. The lastTradeBarTime variable is used as a time reference to ensure that the main logic executes only once per newly formed candle.
Before processing begins inside the OnCalculate function, the indicator first checks whether there are enough historical bars available for analysis. This is important because swing detection requires comparing candles before and after each potential swing point. If the total number of bars is less than look back + EX SwingLookback , the function exits immediately ( return 0 ). This prevents invalid calculations and out-of-range errors.
The indicator uses iTime to acquire the time of the most recent candle. To ascertain whether a new candle has formed, this value is compared to the previously saved lastTradeBarTime. A new bar has appeared, and the processing logic is permitted to operate if the current candle time is different. After confirmation, the lastTradeBarTime is adjusted to reflect the current candle time, guaranteeing that all computations are carried out once per bar and that the logic is not repeated on the same candle.
Once these conditions are confirmed, the program proceeds to begin the process of identifying external swing highs and swing lows, which serve as the foundation for identifying the external market structure.
Note: We will highlight the specific code sections related to each implementation stage as we progress, ensuring each part is clearly understood on its own without mixing it with previously explained sections.
Example:
#property indicator_chart_window
#property indicator_buffers 0
#property indicator_plots   0
#define OBJ_PREFIX      "EISM_"  // Prefix for all chart objects

int look_back     = 1000;        // number of candles to scan for pattern detection
int EX_SwingLookback = 15;       // swing validation range (left and right candles)
datetime lastTradeBarTime = 0;   // ensures logic runs once per new bar
int window_start;                // starting index of scan window

//--- External structure points (swing high/low anchors)
double s1_l;                     // swing 1 low price
datetime s1_l_t;                 // swing 1 low time
double s2_h;                     // swing 2 high price
datetime s2_h_t;                 // swing 2 high time
double s3_l;                     // swing 3 low price
datetime s3_l_t;                 // swing 3 low time
double s4_h;                     // swing 4 high price
datetime s4_h_t;                 // swing 4 high time

//+------------------------------------------------------------------+
//| Custom indicator initialization function                         |
//+------------------------------------------------------------------+
int OnInit()
  {
//--- indicator buffers mapping

//---
   return(INIT_SUCCEEDED);
  }
//+------------------------------------------------------------------+
//| Custom indicator iteration function                              |
//+------------------------------------------------------------------+
int OnCalculate(const int32_t rates_total,
                const int32_t prev_calculated,
                const datetime &time[],
                const double &open[],
                const double &high[],
                const double &low[],
                const double &close[],
                const long &tick_volume[],
                const long &volume[],
                const int32_t &spread[])
  {
//---
//--- Skip processing if not enough bars are available
   if(rates_total < look_back + EX_SwingLookback)
      return 0;

//--- Get the time of the current (latest) candle
   datetime currentBarTime = iTime(_Symbol, PERIOD_CURRENT, 0);

//--- Define the start of the scanning window accounting for swing lookback
   window_start = rates_total - look_back + EX_SwingLookback;

//--- Only execute logic once per new candle to avoid redundant processing
   if(currentBarTime != lastTradeBarTime)
     {
      //--- Scan for swing 1 low (S1) - the start of the external structure
      for(int i = window_start; i < rates_total - EX_SwingLookback - 2; i++)
        {
         if(IsSwingLow(low, i, EX_SwingLookback))
           {
            s1_l   = low[i];   // record S1 low price
            s1_l_t = time[i];  // record S1 low time

            //--- Scan forward for swing 2 high (S2) above S1 low
            for(int j = i; j < rates_total - EX_SwingLookback - 2; j++)
              {
               if(IsSwingHigh(high, j, EX_SwingLookback) && high[j] > s1_l)
                 {
                  s2_h   = high[j];  // record S2 high price
                  s2_h_t = time[j];  // record S2 high time

                  //--- Scan forward for swing 3 low (S3) below S2 high
                  for(int k = j; k < rates_total - EX_SwingLookback - 2; k++)
                    {
                     if(IsSwingLow(low, k, EX_SwingLookback) && low[k] < s2_h)
                       {
                        s3_l   = low[k];   // record S3 low price
                        s3_l_t = time[k];  // record S3 low time

                        //--- Scan forward for swing 4 high (S4) above S2 high - confirms external bullish structure
                        for(int l = k; l < rates_total - EX_SwingLookback - 2; l++)
                          {
                           if(IsSwingHigh(high, l, EX_SwingLookback) && high[l] > s2_h)
                             {
                              s4_h   = high[l];  // record S4 high price
                              s4_h_t = time[l];  // record S4 high time

                              break;
                             }
                          }
                        break;
                       }
                    }
                  break;
                 }
              }
           }
        }

      lastTradeBarTime = currentBarTime; // update last processed bar time to prevent re-running on same candle
     }

//--- return value of prev_calculated for next call
   return(rates_total);
  }

//+------------------------------------------------------------------+
//| Returns true if the bar at index is a swing low                  |
//| Checks that it is lower than all bars within the lookback range  |
//+------------------------------------------------------------------+
bool IsSwingLow(const double &low_price[], int index, int lookback)
  {
   for(int i = 1; i <= lookback; i++)
     {
      //--- Fail if any left or right neighbour is lower than the candidate bar
      if(low_price[index] > low_price[index - i] || low_price[index] > low_price[index + i])
         return false;
     }
   return true; // all neighbours are higher - confirmed swing low
  }

//+------------------------------------------------------------------+
//| Returns true if the bar at index is a swing high                 |
//| Checks that it is higher than all bars within the lookback range |
//+------------------------------------------------------------------+
bool IsSwingHigh(const double &high_price[], int index, int lookback)
  {
   for(int i = 1; i <= lookback; i++)
     {
      //--- Fail if any left or right neighbour is higher than the candidate bar
      if(high_price[index] < high_price[index - i] || high_price[index] < high_price[index + i])
         return false;
     }
   return true; // all neighbours are lower - confirmed swing high
  }
//+------------------------------------------------------------------+
Explanation:
Finding out if a candle is a legitimate swing low is the responsibility of the IsSwingLow function. It accomplishes this by comparing the candidate candle's low with the lows of a predetermined number of candles on both its left and right sides, as indicated by the lookback parameter. The candle is rejected and cannot be regarded as a swing low if any nearby candle has a lower low than the candidate candle. The low of the candle is only verified as a legitimate swing low when it is lower than all nearby candles within the range. The IsSwingHigh function, which determines whether a candle's high is higher than all nearby highs within the lookback range, functions similarly but in reverse. The candidate is discarded if any surrounding candle has a higher value; if not, it is verified as a legitimate swing high.
The program uses window_start = rates_total - look_back + EX_SwingLookback to set the scanning window's beginning point after swing detection logic has been defined. By leaving enough candles on both sides of each possible swing point for appropriate validation, this guarantees that the indicator only examines the most recent section of historical data. The inclusion of EX_SwingLookback ensures that swing detection does not try to assess candles that are too near the dataset's boundaries, where a complete comparison is not feasible.
The program starts building the external market structure after defining the scanning window. It starts by looking for the initial swing low (S1), which is where a possible bullish structure may begin. To confirm that the price has made a legitimate upward move, it looks forward for a swing high (S2) that forms above S1. After that, the algorithm looks for a swing low (S3) below S2 and then a swing high (S4) above S2. A bullish market pattern is built upon this series of S1, S2, S3, and S4. Before the program moves on to more in-depth analysis, each step is verified using the swing detection functions and verified conditions to make sure that only significant structural formations are recorded.
The next step is to ensure the detected swing points form a valid and reliable market structure.
Example:
//--- Refined price extremes between external swing points
int s3_s4_lbars;           // bar count between s3 low and s4 high
int s3_lowest_index;       // index of lowest low between s3 and s4
double s3_lowest;          // lowest low price between s3 and s4
datetime s3_lowest_t;      // time of lowest low between s3 and s4

int s2_s3_hbars;           // bar count between s2 high and s3 lowest
int s2_higest_index;       // index of highest high between s2 and s3 lowest
double s2_highest;         // highest high price between s2 and s3 lowest
datetime s2_highest_t;     // time of highest high between s2 and s3 lowest

int s1_s2_lbars;           // bar count between s1 low and s2 highest
int s1_lowest_index;       // index of lowest low between s1 and s2 highest
double s1_lowest;          // lowest low price between s1 and s2 highest
datetime s1_lowest_t;      // time of lowest low between s1 and s2 highest

//--- Object name strings for external structure lines and labels
string line_s1_2;          // trendline from swing 1 low to swing 2 high
string line_s2_3;          // trendline from swing 2 high to swing 3 low
string line_s3_4;          // trendline from swing 3 low to swing 4 high
string EXLow;              // text label for external low
string EXHigh;             // text label for external high

//+------------------------------------------------------------------+
//| Create or update a trendline                                     |
//| Returns true if a new object was created                         |
//+------------------------------------------------------------------+
bool DrawTrend(const string name,
               datetime x1t, double x1,
               datetime x2t, double x2,
               color fillCol)
  {
   bool created = false;

//--- Create object only if it does not exist
   if(ObjectFind(0, name) < 0)
     {
      ObjectCreate(0, name, OBJ_TREND, 0, x1t, x1, x2t, x2);
      //--- Set object properties
      ObjectSetInteger(0, name, OBJPROP_COLOR, fillCol);

      created = true;
     }

   return created;
  }

//+------------------------------------------------------------------+
//| Create text objects on the chart                                 |
//+------------------------------------------------------------------+
bool DrawTxt(const string name,
             datetime xt, double x,
             string message, color fillCol)
  {
   bool created = false;

//--- Create object only if it does not exist
   if(ObjectFind(0, name) < 0)
     {
      ObjectCreate(0, name, OBJ_TEXT, 0, xt, x);
      ObjectSetString(0, name, OBJPROP_TEXT, message);
      ObjectSetInteger(0, name, OBJPROP_COLOR, fillCol);

      created = true;
     }

   return created;
  }
//+------------------------------------------------------------------+
//| Custom indicator initialization function                         |
//+------------------------------------------------------------------+
int OnInit()
  {
//--- indicator buffers mapping

//---
   return(INIT_SUCCEEDED);
  }
//+------------------------------------------------------------------+
//| OnDeinit - runs when indicator is removed from chart             |
//+------------------------------------------------------------------+
void OnDeinit(const int reason)
  {
//--- Remove all objects created by this indicator
   ObjectsDeleteAll(0, OBJ_PREFIX);
  }
Example:
//+------------------------------------------------------------------+
//| Custom indicator iteration function                              |
//+------------------------------------------------------------------+
int OnCalculate(const int32_t rates_total,
                const int32_t prev_calculated,
                const datetime &time[],
                const double &open[],
                const double &high[],
                const double &low[],
                const double &close[],
                const long &tick_volume[],
                const long &volume[],
                const int32_t &spread[])
  {
//---
//--- Skip processing if not enough bars are available
   if(rates_total < look_back + EX_SwingLookback)
      return 0;

//--- Get the time of the current (latest) candle
   datetime currentBarTime = iTime(_Symbol, PERIOD_CURRENT, 0);

//--- Define the start of the scanning window accounting for swing lookback
   window_start = rates_total - look_back + EX_SwingLookback;

   bool need_redraw = false; // tracks whether any new object was drawn this pass

//--- Only execute logic once per new candle to avoid redundant processing
   if(currentBarTime != lastTradeBarTime)
     {
      //--- Scan for swing 1 low (S1) - the start of the external structure
      for(int i = window_start; i < rates_total - EX_SwingLookback - 2; i++)
        {
         if(IsSwingLow(low, i, EX_SwingLookback))
           {
            s1_l   = low[i];   // record S1 low price
            s1_l_t = time[i];  // record S1 low time

            //--- Scan forward for swing 2 high (S2) above S1 low
            for(int j = i; j < rates_total - EX_SwingLookback - 2; j++)
              {
               if(IsSwingHigh(high, j, EX_SwingLookback) && high[j] > s1_l)
                 {
                  s2_h   = high[j];  // record S2 high price
                  s2_h_t = time[j];  // record S2 high time

                  //--- Scan forward for swing 3 low (S3) below S2 high
                  for(int k = j; k < rates_total - EX_SwingLookback - 2; k++)
                    {
                     if(IsSwingLow(low, k, EX_SwingLookback) && low[k] < s2_h)
                       {
                        s3_l   = low[k];   // record S3 low price
                        s3_l_t = time[k];  // record S3 low time

                        //--- Scan forward for swing 4 high (S4) above S2 high - confirms external bullish structure
                        for(int l = k; l < rates_total - EX_SwingLookback - 2; l++)
                          {
                           if(IsSwingHigh(high, l, EX_SwingLookback) && high[l] > s2_h)
                             {
                              s4_h   = high[l];  // record S4 high price
                              s4_h_t = time[l];  // record S4 high time

                              //--- Find the true lowest low between S3 and S4 to refine external low
                              s3_s4_lbars     = Bars(_Symbol, PERIOD_CURRENT, s3_l_t, s4_h_t);
                              s3_lowest_index = ArrayMinimum(low, k, s3_s4_lbars);
                              s3_lowest       = low[s3_lowest_index];
                              s3_lowest_t     = time[s3_lowest_index];

                              //--- Find the true highest high between S2 and the refined S3 low
                              s2_s3_hbars     = Bars(_Symbol, PERIOD_CURRENT, s2_h_t, s3_lowest_t);
                              s2_higest_index = ArrayMaximum(high, j, s2_s3_hbars);
                              s2_highest      = high[s2_higest_index];
                              s2_highest_t    = time[s2_higest_index];

                              //--- Find the true lowest low between S1 and the refined S2 high
                              s1_s2_lbars     = Bars(_Symbol, PERIOD_CURRENT, s1_l_t, s2_highest_t);
                              s1_lowest_index = ArrayMinimum(low, i, s1_s2_lbars);
                              s1_lowest       = low[s1_lowest_index];
                              s1_lowest_t     = time[s1_lowest_index];

                              //--- Validate the external structure: higher low, lower high inside, and new high above S2
                              if(s1_lowest < s2_highest && s3_lowest < s2_highest && s3_lowest > s1_lowest && s4_h > s2_highest)
                                {
                                 //--- Build unique object names for external structure using swing point times
                                 line_s1_2 = OBJ_PREFIX + "Line S12" + TimeToString(time[i]) + TimeToString(time[j]);
                                 line_s2_3 = OBJ_PREFIX + "Line S23" + TimeToString(time[j]) + TimeToString(time[k]);
                                 line_s3_4 = OBJ_PREFIX + "Line S34" + TimeToString(time[k]) + TimeToString(time[l]);
                                 EXLow     = OBJ_PREFIX + "External Low"  + TimeToString(time[k]) + TimeToString(time[l]);
                                 EXHigh    = OBJ_PREFIX + "External High" + TimeToString(time[k]) + TimeToString(time[l]);

                                 if(DrawTrend(line_s1_2, s1_lowest_t, s1_lowest, s2_highest_t, s2_highest, clrBlue)
                                    && DrawTrend(line_s2_3, s2_highest_t, s2_highest, s3_lowest_t, s3_lowest, clrGreen)
                                    && DrawTrend(line_s3_4, s3_lowest_t, s3_lowest, s4_h_t, s4_h, clrRed)
                                    && DrawTxt(EXLow,  s3_lowest_t, s3_lowest, "EXL", clrRed)
                                    && DrawTxt(EXHigh, s4_h_t,      s4_h,      "EXH", clrGreen))
                                   {
                                    need_redraw = true; // mark chart for redraw
                                   }
                                }

                              break;
                             }
                          }
                        break;
                       }
                    }
                  break;
                 }
              }
           }
        }

      lastTradeBarTime = currentBarTime; // update last processed bar time to prevent re-running on same candle
     }

//--- Redraw the chart only if at least one new object was created
   if(need_redraw)
      ChartRedraw(0);

//--- return value of prev_calculated for next call
   return(rates_total);
  }
Explanation:
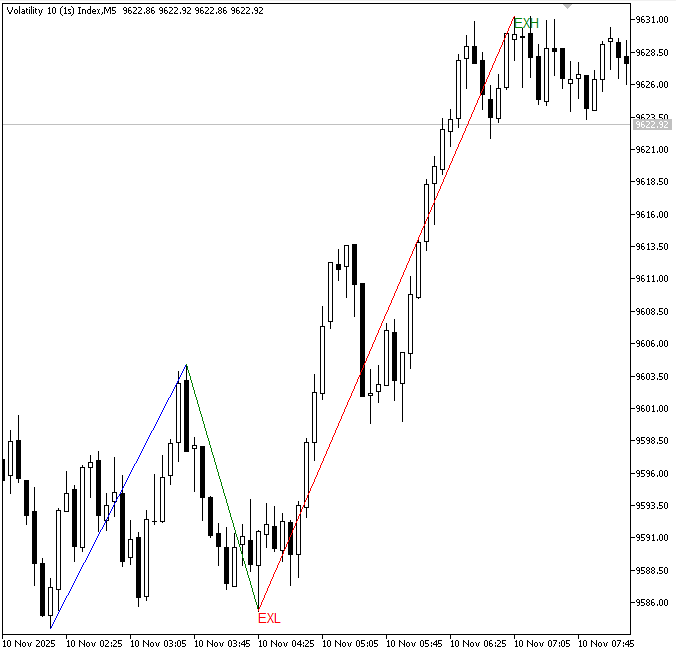
In this stage, we refine the swing points found during the initial scan to enhance the quality of the detected external structure. To identify the actual market extremes, the indicator reexamines the price movement between the initial swing highs and lows rather than using them exactly as they were discovered. The first step in the process is to examine the pricing range between S3 and S4 and look for the lowest low in that range. To ensure that the structure represents the deepest retreat that took place during that stage of the trend, this revised low becomes the external low.
It then looks for the highest high inside that segment after measuring the range between S2 and the recently improved S3 low. By capturing the biggest upward movement before the subsequent structural shift, this stage refines the external high. To get the genuine lowest low at the beginning of the structure and guarantee that the external move's beginning point is precisely defined, the procedure is finally repeated between S1 and the revised S2 high.
The DrawTrend function's goal is to control and effectively manage trendline production. It starts by looking for an item that already exists and has the given name. If none are identified, the required graphic parameters are applied, and a new trendline linking two price points is created. The function prevents needless duplication of graphical objects and lets the indicator know when the chart needs to be updated because it only returns success when a new object is truly produced.
The indicator uses the DrawTxt method to display labels like structural markers and annotations. Initially, the function checks to see if the supplied text object is already present on the chart. If it doesn't, the desired message and color are assigned after a new text object is created at the designated position. It offers a straightforward method of monitoring chart updates while avoiding needless object creation, much as the trendline function, which only reports success when a new object is added.
The program validates the external structure using a fixed set of conditions. It verifies that the price forms a regular sequence of movement and that the lowest point in the structure is appropriately situated below the internal highs. Likewise, it guarantees that S1 is less than S2, S3 stays below S2 but above S1, and S4 breaks above S2. This verifies that before any visualization is used, the market has established a legitimate bullish external structure.
The indicator uses the timestamps of the identified swing points to create distinct names for each chart item after the external structure has been verified. This guarantees that each trendline and label can be controlled individually and keeps newly produced items from replacing previously defined structures. Then, using trendlines to connect S1 to S2, S2 to S3, and S3 to S4, the indicator creates the external structure. Text labels are used to indicate the External Low (EXL) and External High (EXH). A redraw flag is set off if every object is correctly produced, making the finished structure instantly visible on the chart.
The need_redraw flag determines when the chart needs to be updated. ChartRedraw(0) compels MetaTrader 5 to update the chart instantly when it is set to true, making newly produced elements like trendlines, labels, or trade marks visible. By only redrawing the chart when real visual changes take place, this method reduces needless refresh cycles and enhances speed. Furthermore, by eliminating only the objects generated by this indicator, the ObjectsDeleteAll(0, OBJ_PREFIX) function guarantees appropriate cleanup. To avoid interference with manually inserted or external chart items and to maintain the chart's cleanliness after the indicator is removed, it filters objects according to the specified prefix.
First Internal Structure Detection with External Validation Control
This is the second step from the implementation plan, where we analyze internal swings within the confirmed external structure to identify the first break of structure or change of character signals.
Example:
//--- Internal structure swing points
double i_high;       // internal high price
datetime i_high_t;   // internal high time
double i_low;        // internal low price
datetime i_low_t;    // internal low time
int in_bars;         // bar count from s4 high to current scan bar

//--- External structure bar range and search flag
int ex_bars;         // total bar count of the external structure range

//--- Object name strings for internal structure and trade objects
string in_line_s1_2; // trendline from internal high to internal low
string in_line_s1_c; // trendline from internal high to CHoCH cross candle
Example:
//--- Validate the external structure: higher low, lower high inside, and new high above S2
if(s1_lowest < s2_highest && s3_lowest < s2_highest && s3_lowest > s1_lowest && s4_h > s2_highest)
  {
//--- Build unique object names for external structure using swing point times
   line_s1_2 = OBJ_PREFIX + "Line S12" + TimeToString(time[i]) + TimeToString(time[j]);
   line_s2_3 = OBJ_PREFIX + "Line S23" + TimeToString(time[j]) + TimeToString(time[k]);
   line_s3_4 = OBJ_PREFIX + "Line S34" + TimeToString(time[k]) + TimeToString(time[l]);
   EXLow     = OBJ_PREFIX + "External Low"  + TimeToString(time[k]) + TimeToString(time[l]);
   EXHigh    = OBJ_PREFIX + "External High" + TimeToString(time[k]) + TimeToString(time[l]);


   if(DrawTrend(line_s1_2, s1_lowest_t, s1_lowest, s2_highest_t, s2_highest, clrBlue)
      && DrawTrend(line_s2_3, s2_highest_t, s2_highest, s3_lowest_t, s3_lowest, clrGreen)
      && DrawTrend(line_s3_4, s3_lowest_t, s3_lowest, s4_h_t, s4_h, clrRed)
      && DrawTxt(EXLow,  s3_lowest_t, s3_lowest, "EXL", clrRed)
      && DrawTxt(EXHigh, s4_h_t,      s4_h,      "EXH", clrGreen))
     {
      need_redraw = true; // mark chart for redraw
     }

//--- Calculate total bar range of the confirmed external structure
   ex_bars = Bars(_Symbol, PERIOD_CURRENT, s1_lowest_t, s4_h_t);

//--- Scan for internal highs after the external structure completes
   for(int m = l + EX_SwingLookback; m < rates_total - 3 - 2; m++)
     {
      //--- Only search if no valid internal setup has been found yet for this structure
      if(IsSwingHigh(high, m, 3))
        {
         i_high   = high[m]; // record internal high price
         i_high_t = time[m]; // record internal high time

         //--- Scan forward for the first internal low after this internal high
         for(int n = m; n < rates_total - 3 - 2; n++)
           {
            if(IsSwingLow(low, n, 3))
              {
               i_low   = low[n];   // record internal low price
               i_low_t = time[n];  // record internal low time

               //--- Scan forward for a CHoCH candle that crosses above the internal high
               for(int o = n; o <= rates_total - 1; o++)
                 {
                  in_bars = Bars(_Symbol, PERIOD_CURRENT, s4_h_t, time[o]); // bars from S4 to current candle

                  //--- CHoCH condition: candle opens below and closes above the internal high within the structure range
                  if(in_bars <= ex_bars && open[o] < i_high && close[o] > i_high)
                    {
                     //--- Internal low must be below the internal high for a valid IH-IL-CHoCH sequence
                     if(i_low < i_high)
                       {
                        //--- Build unique object names for this internal setup
                        in_line_s1_2 = OBJ_PREFIX + "In Line S12"       + TimeToString(time[m]) + TimeToString(time[n]);
                        in_line_s1_c = OBJ_PREFIX + "In Line Cross S12" + TimeToString(time[m]) + TimeToString(time[o]);

                        //--- Draw internal structure lines, entry arrow, SL, and TP objects
                        if(DrawTrend(in_line_s1_2, i_high_t,  i_high,  i_low_t,  i_low,   clrBlue)
                           && DrawTrend(in_line_s1_c, i_high_t,  i_high,  time[o], i_high,  clrBlue)
                          )
                          {
                           need_redraw = true; // mark chart for redraw
                          }
                       }
                     break;
                    }
                 }

               break;
              }
           }
        }
     }
  }
Output:
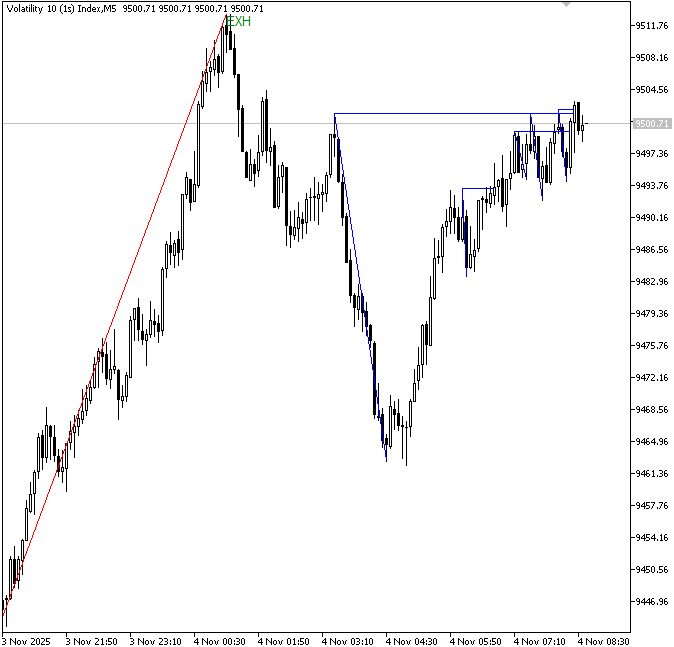
Explanation:
In this step, the indicator begins the process of detecting internal market structure within the already confirmed external structure. First, it calculates the total bar range of the external structure using the time difference between the external low (S1/S3 region) and the external high (S4), which helps to ensure that all internal analysis stays within the valid structural boundary. This range is stored as ex_bars and is later used to prevent the algorithm from detecting internal shifts outside the established external move.
Next, the indicator scans forward from the end of the external structure to identify internal highs using a smaller swing lookback value. These internal highs represent temporary peaks within the broader trend and are the starting point for internal structure analysis. Once an internal high is found, the algorithm records its price and time, then continues scanning forward to locate the first internal low that follows it. This internal low represents a corrective pullback within the structure.
After both the internal high and internal low are identified, the indicator searches for a Change of Character (CHoCH) event. This occurs when a candle breaks above the internal high by opening below it and closing above it, confirming a bullish internal shift. However, this breakout is only considered valid if it occurs within the previously calculated external structure range, ensuring that the signal is structurally relevant and not outside the main trend context.
The indicator creates distinct object names for the internal setup and draws the associated internal structure lines on the chart after a valid CHoCH is verified. The internal high and internal low are connected by the first line, while the internal high and the breakout candle are connected by the second line. A flag is set to refresh the chart and make the new internal structure instantly visible when these items are successfully formed.
One issue with the current implementation is that it is detecting multiple Change of Character (CHoCH) or break of structure events within the same external structure, instead of focusing only on the first valid internal shift. Ideally, once the external structure is confirmed, the indicator should identify only the first occurrence of a CHoCH or break of structure and then stop further internal scanning for that structure. However, in the current logic, the loop continues to evaluate subsequent internal setups, which leads to multiple signals being generated within a single external market phase.
Now we need to modify the program to align it with the intended logic, ensuring that only the first valid Change of Character (CHoCH) or break of structure is detected after the external structure is confirmed. This adjustment will refine the indicator’s behavior by preventing multiple internal signals within a single external structure and ensuring that each external phase produces only one clear internal shift for analysis. We also have to ensure that the external high and external low have not been broken after confirmation of the external structure.
Example:
//--- External structure bar range and search flag
int ex_bars;   // total bar count of the external structure range
bool found;    // flag — true once a valid internal setup is found for this structure
Example:
//--- Validate the external structure: higher low, lower high inside, and new high above S2
if(s1_lowest < s2_highest && s3_lowest < s2_highest && s3_lowest > s1_lowest && s4_h > s2_highest)
  {

//--- Build unique object names for external structure using swing point times
   line_s1_2 = OBJ_PREFIX + "Line S12" + TimeToString(time[i]) + TimeToString(time[j]);
   line_s2_3 = OBJ_PREFIX + "Line S23" + TimeToString(time[j]) + TimeToString(time[k]);
   line_s3_4 = OBJ_PREFIX + "Line S34" + TimeToString(time[k]) + TimeToString(time[l]);
   EXLow     = OBJ_PREFIX + "External Low"  + TimeToString(time[k]) + TimeToString(time[l]);
   EXHigh    = OBJ_PREFIX + "External High" + TimeToString(time[k]) + TimeToString(time[l]);

   if(DrawTrend(line_s1_2, s1_lowest_t, s1_lowest, s2_highest_t, s2_highest, clrBlue)
      && DrawTrend(line_s2_3, s2_highest_t, s2_highest, s3_lowest_t, s3_lowest, clrGreen)
      && DrawTrend(line_s3_4, s3_lowest_t, s3_lowest, s4_h_t, s4_h, clrRed)
      && DrawTxt(EXLow,  s3_lowest_t, s3_lowest, "EXL", clrRed)
      && DrawTxt(EXHigh, s4_h_t,      s4_h,      "EXH", clrGreen))
     {
      need_redraw = true; // mark chart for redraw
     }

//--- Calculate total bar range of the confirmed external structure
   ex_bars = Bars(_Symbol, PERIOD_CURRENT, s1_lowest_t, s4_h_t);
   found   = false; // reset search flag for this structure

//--- Scan for internal highs after the external structure completes
   for(int m = l + EX_SwingLookback; m < rates_total - 3 - 2; m++)
     {
      //--- Only search if no valid internal setup has been found yet for this structure
      if(found == false && IsSwingHigh(high, m, 3))
        {
         i_high   = high[m]; // record internal high price
         i_high_t = time[m]; // record internal high time

         //--- Scan forward for the first internal low after this internal high
         for(int n = m; n < rates_total - 3 - 2; n++)
           {
            if(IsSwingLow(low, n, 3))
              {
               i_low   = low[n];   // record internal low price
               i_low_t = time[n];  // record internal low time

               //--- Scan forward for a CHoCH candle that crosses above the internal high
               for(int o = n; o <= rates_total - 1; o++)
                 {
                  in_bars = Bars(_Symbol, PERIOD_CURRENT, s4_h_t, time[o]); // bars from S4 to current candle

                  //--- CHoCH condition: candle opens below and closes above the internal high within the structure range
                  if(in_bars <= ex_bars && open[o] < i_high && close[o] > i_high)
                    {
                     //--- Internal low must be below the internal high for a valid IH-IL-CHoCH sequence
                     if(i_low < i_high)
                       {
                        //--- Check whether a previous internal structure already exists between m and o
                        bool is_prev_in = false;

                        //--- Scan for any earlier internal high between the current IH and CHoCH candle
                        for(int x = m + 1; x <= o - 2; x++)
                          {
                           if(IsSwingHigh(high, x, 3))
                             {
                              //--- Scan for an internal low after that earlier high
                              for(int y = x; y <= o - 2; y++)
                                {
                                 if(IsSwingLow(low, y, 3))
                                   {
                                    //--- Check if a CHoCH already occurred for that earlier internal high
                                    for(int z = y; z < o; z++)
                                      {
                                       if(open[z] < high[x] && close[z] > high[x])
                                         {
                                          is_prev_in = true; // a prior internal sequence already fired

                                          break; // stop scanning - prior internal found
                                         }
                                      }
                                    break; // use only the first internal low after x
                                   }
                                }
                             }
                          }

                        //--- Find the lowest low from S3 to the CHoCH candle for external low validation
                        exll_bars = Bars(_Symbol, PERIOD_CURRENT, s3_lowest_t, time[o]);
                        exll      = low[ArrayMinimum(low, s3_lowest_index, exll_bars)];

                        //--- Find the highest high from S4 to the CHoCH candle for external high validation
                        exhh_bars = Bars(_Symbol, PERIOD_CURRENT, s4_h_t, time[o]);
                        exhh      = high[ArrayMaximum(high, l, exhh_bars)];

                        //--- Build unique object names for this internal setup
                        in_line_s1_2 = OBJ_PREFIX + "In Line S12"       + TimeToString(time[m]) + TimeToString(time[n]);
                        in_line_s1_c = OBJ_PREFIX + "In Line Cross S12" + TimeToString(time[m]) + TimeToString(time[o]);

                        //--- Draw objects only if no prior internal exists and external structure is still intact
                        if(is_prev_in == false && exll == s3_lowest && exhh == s4_h)
                          {
                           //--- Draw internal structure lines, entry arrow, SL, and TP objects
                           if(DrawTrend(in_line_s1_2, i_high_t,  i_high,  i_low_t,  i_low,   clrBlue)
                              && DrawTrend(in_line_s1_c, i_high_t,  i_high,  time[o], i_high,  clrBlue)
                             )
                             {
                              need_redraw = true; // mark chart for redraw
                             }
                          }
                       }

                     found = true; // mark this structure as processed - stop scanning m for new internal highs
                     break;
                    }
                 }

               break;
              }
           }
        }
     }
  }
Output:
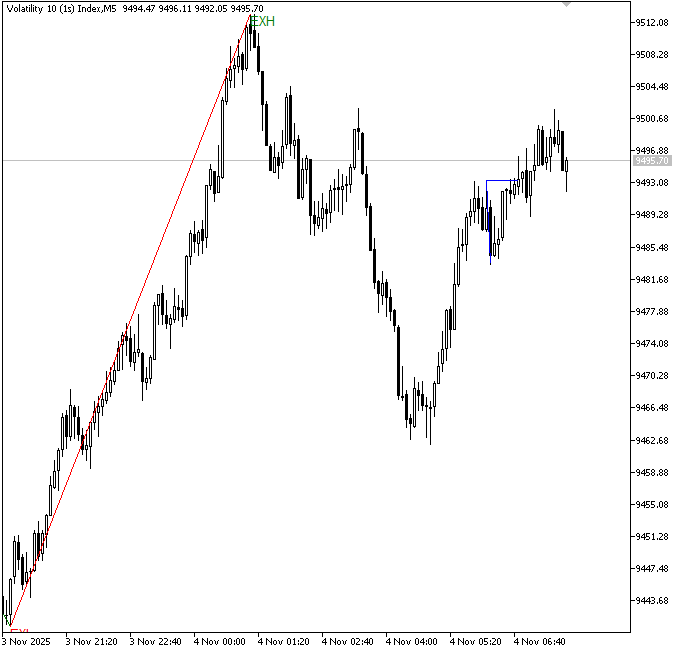
Explanation:
The program stops the generation of several internal signals within the same external structure. To indicate that no previous internal structure has yet been found, it first initializes a boolean flag called is_prev_in to false. The program then scans the price action between the current internal high candidate (m) and the CHoCH candle (o) to check whether an earlier internal setup already exists. It does this by first searching for any earlier internal high within that range, then looking forward for the first internal low after that high.
Once this internal high and low sequence is found, it checks whether a CHoCH has already occurred by verifying if any candle within that segment opens below the internal high and closes above it. If this condition is met, it means an internal structure has already triggered a valid breakout, so is_prev_in is set to true and the loop breaks immediately to avoid further unnecessary checks. This ensures that only the first valid internal structure is considered and prevents duplicate internal signals within the same external structure.
The next part of the logic focuses on validating whether the external structure is still intact at the point where the internal CHoCH is detected. This is done by recalculating the lowest and highest price boundaries of the external structure up to the CHoCH candle. First, the code finds the lowest low between the refined external low region (starting from S3) and the CHoCH candle. This value, stored as exll, ensures that no deeper low has formed after the external structure was established. Next, it finds the highest high between the external high (S4) and the CHoCH candle, stored as exhh, to confirm that price has not broken above the original external high during the internal movement. Together, these calculations act as a real-time integrity check to ensure the external structure remains valid before any internal signal is accepted.
After both validations are complete, the final condition determines whether the internal structure should be drawn on the chart. The indicator only proceeds if no previous internal structure exists (is_prev_in == false), the external low remains unchanged (exll == s3_lowest), and the external high is still intact (exhh == s4_h). When all these conditions are satisfied, it confirms that the detected internal CHoCH is the first valid one within a clean and unbroken external structure. At this point, the program draws the internal structure lines connecting the internal high and internal low to visually represent the market movement. Finally, the found flag is set to true, which stops further scanning for additional internal setups within the same external structure, ensuring that only one clean and valid internal signal is produced per external trend.
Visualization and Trade Setup Generation with Object Handling
This is the last step, where we convert the confirmed internal and external market structure into a complete trade setup.
Example:
//--- Trade objects calculation variables
double tp;           // computed take profit price (1.5R)
string tp_line;      // take profit horizontal line object name
string tp_txt;       // take profit text label object name
string buy_obj;      // buy arrow object at entry candle
string sl_line;      // stop loss horizontal line
string sl_txt;       // stop loss text label
Example:
//+------------------------------------------------------------------+
//| Create arrow or shape objects on the chart                       |
//+------------------------------------------------------------------+
bool DrawObject(const string name,
                datetime xt, double x,
                ENUM_OBJECT obj_type)
  {
   bool created = false;

//--- Create object only if it does not exist
   if(ObjectFind(0, name) < 0)
     {
      ObjectCreate(0, name, obj_type, 0, xt, x);
      created = true;
     }

   return created;
  }
Example:
//--- Calculate take profit at 1.5x the risk from entry close
tp      = close[o] + ((close[o] - low[n]) * 1.5);
tp_line = OBJ_PREFIX + "TP Line" + TimeToString(time[n]) + TimeToString(time[o]);
tp_txt  = OBJ_PREFIX + "TP Text" + TimeToString(time[o]);
buy_obj      = OBJ_PREFIX + "Buy Object"         + TimeToString(time[o]);
sl_line      = OBJ_PREFIX + "SL Line"            + TimeToString(time[n]) + TimeToString(time[o]);
sl_txt       = OBJ_PREFIX + "SL Text"            + TimeToString(time[o]);

//--- Draw objects only if no prior internal exists and external structure is still intact
if(is_prev_in == false && exll == s3_lowest && exhh == s4_h)
  {
//--- Draw internal structure lines, entry arrow, SL, and TP objects
   if(DrawTrend(in_line_s1_2, i_high_t,  i_high,  i_low_t,  i_low,   clrBlue)
      && DrawTrend(in_line_s1_c, i_high_t,  i_high,  time[o], i_high,  clrBlue
                   && DrawObject(buy_obj,     time[o],   close[o],          OBJ_ARROW_BUY)
                   && DrawTrend(sl_line,      time[n],   low[n],  time[o], low[n],  clrBlue)
                   && DrawTxt(sl_txt,         time[o],   low[n],  "SL",    clrBlue)
                   && DrawTrend(tp_line,      time[n],   tp,      time[o], tp,      clrBlue)
                   && DrawTxt(tp_txt,         time[o],   tp,      "TP",    clrBlue))
     )
     {
      need_redraw = true; // mark chart for redraw
     }
  }
Output:
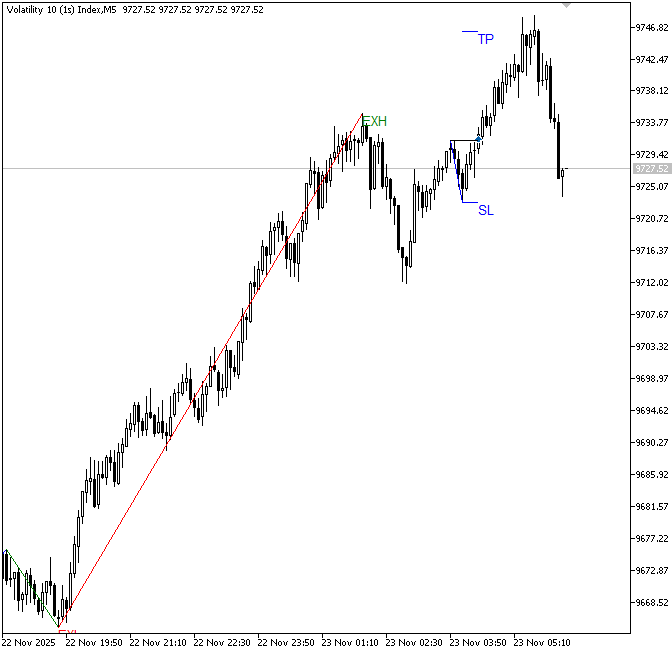
Explanation:
This part of the code is responsible for defining the trade management levels once a valid internal structure and CHoCH have been confirmed. The first calculation determines the take profit level using a fixed risk-to-reward ratio of 1.5. The risk is measured as the distance between the entry price (the close of the CHoCH candle at close[o]) and the stop loss level (the internal low at low[n]). This risk is then multiplied by 1.5 and added to the entry price to project the take profit level upward. This ensures that every trade setup is based on a consistent reward structure derived directly from market volatility rather than arbitrary values.
After calculating the take profit, the code assigns unique object names for all trade elements, including the take profit line and label, the buy signal marker, the stop loss line, and the stop loss label. The purpose of this initial block of code is to stop the generation of several internal signals within the same external structure. The indicator completes a final confirmation phase to guarantee structural accuracy before showing any trade-related objects. By ensuring that no previous internal structure has been found, it guarantees that this is the first genuine internal signal. It also confirms that the external boundaries are still intact by comparing exll and exhh with their initial validated values. The rendering process is blocked, and no trade setup is plotted if these requirements are not met.
Once validation is complete, the indicator draws all trade execution elements on the chart. It places a buy arrow at the entry candle, draws the stop-loss line at the internal low, and marks it with an "SL" label. It also draws the take profit line at the calculated target level and labels it with "TP." If all drawing operations are successful, the need_redraw flag is set to true so the chart is immediately refreshed to display the completed trade setup.
Conclusion
By completing this article, we have established a complete and structured framework for detecting internal and external market structure in MQL5, designed as a practical and verifiable approach before full implementation. The focus was on breaking the entire detection process into clear, logical stages that ensure accuracy, consistency, and easier debugging throughout development. The system is built around the following key components:
- swing detection for identifying valid market turning points;
- external structure construction and refinement to define the true market extremes;
- internal structure detection to capture market behavior within the broader trend;
- CHoCH and break of structure validation to confirm internal shifts in momentum;
- entry, stop loss, and take profit placement derived directly from market structure.
This framework provides a structured and rule-based approach to market structure analysis in MQL5, improving reliability, clarity, and consistency in both pattern recognition and trade execution logic.
Warning: All rights to these materials are reserved by MetaQuotes Ltd. Copying or reprinting of these materials in whole or in part is prohibited.
This article was written by a user of the site and reflects their personal views. MetaQuotes Ltd is not responsible for the accuracy of the information presented, nor for any consequences resulting from the use of the solutions, strategies or recommendations described.

 Building Volatility Models in MQL5 (Part IV): Implementing Long Memory Volatility Processes, FIGARCH, and HARCH
 Dream Optimization Algorithm (DOA)
 Beyond Maximum Drawdown: Building a Drawdown DNA Analyzer in MQL5
 Creating an EMA Crossover Forward Simulation (Culmination): Interactive Synthetic Candles

- Free trading apps
- Over 8,000 signals for copying
- Economic news for exploring financial markets
You agree to website policy and terms of use