Neural Networks in Trading: A Spatio-Temporal State-Space Model for Financial Data Analysis (E-STMFlow)
 53
 0

Introduction
The market does not run on a schedule. It moves in bursts, changing pace. Sometimes it speeds up, sometimes it quiets down. Every event (a trade, a spike in volume, a sharp surge) is like a brief flash that alters the course of the entire structure. Financial data has long since ceased to be a calm, smooth sequence of numbers. It is more like a stream of sparks, with a new part of the picture emerging every moment. And this is precisely where the main challenge lies: many models simply cannot keep up with these rapidly changing dynamics.
Traditional methods still view the market as a sequence of evenly spaced points: they require fixed steps, regular intervals, and neatly aligned data. But the market does not know what a uniform interval is. It twitches, pulsates, and creates events where there was nothing just a second ago. When a model requires perfectly formatted data, it misses the very essence of the real-world stream — its endless asynchrony. It sees only the result, but overlooks the process.
This problem is particularly noticeable in high-frequency data. Trades arrive at irregular intervals. Liquidity changes direction without warning. The order book breathes faster than any conventional model can handle. Some algorithms are too slow. Others are too superficial. Transformers deliver powerful representations, but they require too much computation. Recurrent models respond more quickly, but they easily lose track of the relationships between events. As a result, the researcher once again faces a choice: speed or depth. But the market demands both at the same time.
Seeing this kind of situation, I find myself wanting a model that can move in step with the market, rather than playing catch-up. A model that responds to every event as easily as a pendulum responds to a new nudge. A model that stores the market's internal state — its hidden momentum, liquidity pressure, and participant sentiment — in memory, and updates it every time a new data point becomes available.
This is exactly where the concept of a state-space model really comes into its own. It does not view the market as a series of discrete points, but rather describes it as a continuous process. The state changes smoothly. Each event is not merely recorded; it influences the evolution of the entire system.
In the paper "Spatio-Temporal State Space Model for Efficient Event-Based Optical Flow," a new approach was proposed to solve a problem that, at first glance, seems far removed from financial markets but is surprisingly similar in its underlying logic. The framework was developed to process event data received from dynamic sensors that detect changes in the monitored area. This is a stream of micro-events, each of which carries a signal about local movement. In this environment, there are no regularly spaced frames and no fixed intervals. Only a continuous stream of changes, which requires models capable of handling a live, asynchronous signal.
The creators of the E-STMFlow framework have proposed a system that describes the dynamics of a scene through a hidden state that is updated with each new event. This state exists continuously, like a thin thread stretching across the entire data stream. The model does not wait for data to accumulate or collect large blocks; instead, it responds to every microburst. The spatial component indicates where an event occurred, and the temporal component indicates when. Together, they form a structure that makes it possible to track movement just as easily as the eye detects an object's displacement in peripheral vision.
The architecture uses linear state transitions and efficient updates, and computations are performed quickly and with almost no unnecessary operations. The model does not attempt to store the entire history; it stores only the essence — the current vector of internal dynamics.
This approach gave the model several important advantages. First, high speed: the absence of computationally intensive blocks allows updates to be performed almost instantly. Second, compactness: the model uses only a small number of parameters, so it is more resistant to noise and does not require vast computing resources. Third, the ability to work with asynchronous data: the framework is designed specifically for irregular event streams, where it is important to respond to each individual event rather than to an artificially created time grid. And finally, high accuracy: the hidden state helps capture motion not as the sum of individual fragments, but as a continuous process. This makes the model particularly stable under challenging dynamic conditions.
For financial markets, this logic turns out to be surprisingly natural. The market, like an event sensor, generates signals not at a uniform rate but in bursts. Every trade is a small event that shifts the entire system. Liquidity flows resemble the movement of texture in an image, and spikes in activity are similar to local changes in brightness. The market also changes continuously, even though we observe it through discrete data. And if we view it as a continuous process of hidden states, we can discern structures that simply get lost in the noise in traditional models.
The framework's advantages are particularly significant in this context. Its event-driven nature aligns perfectly with the asynchronous flow of trades and orders. The ability to update its internal state with every event makes it possible to model the market almost in sync with its pulse. Its compactness makes the model stable in the presence of market noise, which inevitably accompanies every price movement. And the spatiotemporal structure makes it possible to view the market not only as a sequence of trades, but also as a dynamic information field in which every burst of activity becomes part of the overall movement.
The result is an approach that can serve as a direct bridge between analytics and actual market behavior. It makes the analysis more flexible, faster, and more faithful to the structure of events. Such a framework does not attempt to force the market to conform to its own rules — on the contrary, it adapts to the market’s natural rhythm. And it is precisely because of this that it can serve as the foundation for a new class of models capable of seeing beyond price changes to the hidden processes that drive them.
The E-STMFlow Algorithm
The easiest way to understand the logic behind E-STMFlow is to start with the basics of optical flow. The very foundation that has shaped the methods of motion analysis for decades. In optical flow, everything is based on the assumption that brightness remains constant. If a point in the image shifts but its brightness remains the same, the following fundamental relationship holds:

There is a similar concept in trading. Price alone does not tell us much until we consider how it changes over time. The same applies here — what matters is how the intensity changes spatially and over time.
Expanding the brightness in a Taylor series yields the classical optical flow equation:
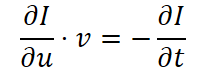
Here, v is the velocity.
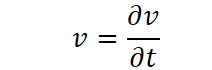
This equation relates the spatial and temporal derivatives of the image. This is very similar to a market situation where price changes depend not only on the current level but also on the instantaneous dynamics of supply and demand.
However, this equation alone is not sufficient to uniquely determine the flow. Therefore, we introduce the assumption of spatial consistency, which is similar to the perspective of a trader who assesses the market based on the local context. For a set of points in the neighborhood Ω(u,t), the problem reduces to minimizing the squared error:

The analytical solution is given in closed form:

The matrices Φ and Θ contain spatial and temporal derivatives, respectively. This conclusion underscores the fact that a correct estimation of flow is impossible without simultaneously taking space and time into account. This is precisely where it becomes clear why many modern methods introduce cumbersome four-dimensional correlation tensors and carry contextual events along with them. They are like analysts who try to play it safe by gathering an excessive number of indicators. Formally, this works, but the efficiency of such approaches is questionable, since processing excess context slows down the system and increases computational costs.
The framework's authors rightly point out that the problem can be solved much more elegantly if we look at the structure of the event stream from the perspective of a dynamical system. Each event ek(t) = (uk, vk, tk, pk) represents a compact set of information about the spatiotemporal coordinates and the sign of the brightness change. An event occurs when a change in intensity reaches a threshold.

This threshold C is like the minimum tick movement in the market that must be exceeded for a trading algorithm to consider it a significant signal.
If the time interval is short, the change in intensity can be approximated.

In that case, the condition for the event to occur takes the form:
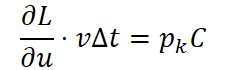
Together with the optical flow equation, this leads to an important conclusion: every event contains information about motion. Similarly, in tick data, each microstructural trade reflects an internal acceleration or deceleration of the market — a brief burst of activity that combines with others to form a complete flow.
And if events already contain motion, there is no need to construct computationally expensive 4D correlation structures. Instead, the authors suggest viewing the sequence of events as the evolution of the system's state. This interpretation paves the way for a stochastic model, in which motion is described by internal dynamics rather than external correlations. This forms the basis for the STSSM block — the heart of a new architecture that efficiently encodes the dynamics of event data. And this concept translates particularly well to financial analysis, where compactness, speed, and the ability to maintain the system’s hidden state become key advantages over traditional, resource-intensive methods of processing market data streams.
When it comes to models capable of capturing dynamics over time, it is impossible to ignore the classical description of a system's state using a linear time-invariant approach. This idea, as old as the field of automation engineering itself, surprisingly lends itself well to the analysis of complex data streams — whether they consist of events captured by a video camera or market ticks that drive price movements. And although at first glance these phenomena seem to belong to different worlds, the mathematical structure describing their dynamics is surprisingly similar.
The linear time-invariant approach provides a tool for formulating the evolution of a state as a matrix equation.

This equation is essentially similar to a model that tracks price movements under the influence of external forces. The state X(t) is much like hidden market factors: the trend component, volatility, and momentum. The input Z(t) is a stream of observed changes, whether in pixel brightness or price. And the output Y(t) is our attempt to extract a useful signal.
Matrix A, which governs the dynamics, serves as a kind of master plan for the system. It specifies how the current state influences the future, much as real-world market processes inherit a historical structure. Long periods of calm are followed by bursts of activity, and all of this is governed by hidden laws.
Matrices B and C determine how much the input changes the state and how accurately the state is reflected in the observation. This is similar to how different markets react differently to the same news event: in some cases, the impact is immediate, while in others, it is spread out over time.
However, the continuous-time model itself is not always convenient for practical computations. Therefore, the system is converted to a discrete-time format using, for example, the zero-order hold method. This turns the dynamics into a sequence of steps.

And the transition between states takes the form:

This format offers a level of flexibility that cannot be achieved with conventional recurrent models. And this is critically important when working with dense event streams, where you need to take into account both temporal and spatial relationships. In the world of finance, this model is very similar to high-frequency analysis. The data arrives asynchronously; the intervals between events are irregular; and each new data point on the graph adds a tiny but significant piece of information to the overall picture. Against this backdrop, structured SSM models stand out as true workhorses — powerful, efficient, and capable of processing long sequences without losing stability.
And yet, progress does not stand still. It has become clear that even a structured state is sometimes insufficient to capture the rich dynamics of the event stream. That is how the idea of making the model's parameters dependent on the input data came about. That, in essence, is adaptability. Instead of a static system, we get a living organism capable of changing its properties depending on the data stream entering it. This gave rise to the selection mechanism that became the heart of the Mamba architecture.
In this approach, the time step Δ, as well as the matrices B and C, are no longer fixed. They adapt to the data stream being analyzed, yielding a linear time-varying system. As a result, this model can respond to complex, high-frequency events almost like an experienced trader who recognizes when the market becomes nervous, detects phase transitions, and adjusts their sensitivity to the structure of the incoming data stream.
This is particularly important in the context of motion estimation. As is well known, optical flow requires not only temporal but also spatial coherence. Many approaches use two temporally consecutive projections of the data — a reference projection and a target projection. This makes it possible to establish a correspondence between them. However, if the event window is large enough, it becomes possible to do away with this approach entirely. The sequence itself turns out to be sufficient to reconstruct the motion FtR→tT.
This is similar to market analysis, where, given a sufficiently extensive tick history, one can identify the trend direction without relying on additional aggregated data. Every tick is an event. Every burst of activity is part of an underlying movement. And if the history window is wide enough, we can directly reconstruct the structure of the dynamics.
In this case, the 4D correlation volumes that burden many modern methods become unnecessary. They are bulky, memory-intensive, and inefficient. It is much more natural — and mathematically elegant — to extract spatiotemporal dependencies using state-space models, which do so directly from the event stream. It is precisely this architecture that paves the way for faster, lighter, and more accurate algorithms for analyzing dynamics.
And, what is particularly important in the context of financial markets, this approach makes it possible to build models that can handle long time series without being overwhelmed by the density of events. They can account for both short-term spikes and the long-term structure of the data. The Spatio-Temporal State Space Model provides a toolkit that is more in tune with the real market: dynamic, adaptive, and capable of working where traditional methods begin to falter.
When we move on to designing the model architecture, it becomes clear that the form of the input data determines how all subsequent processing is performed. The model cannot outperform the data it is given, so the framework's authors begin by carefully constructing an event volume as a compact three-dimensional grid. Time becomes just as much of an axis as price and volume in exchange ticker tapes.
This 3D representation of events provides the foundation for accurately extracting dynamics. E-STMFlow takes an event stream and converts it into a uniformly gridded tensor. A simple yet accurate analogue of a candlestick chart, where price is smoothed over time, but every microstructural detail remains in place.
Essentially, the framework's developers carefully distribute the contribution of each event across the nearest coordinates in space and time, minimizing the discretization error as much as possible. This is similar to carefully constructing a market volume profile. Every action taken in the market makes a small contribution to the overall liquidity density. And the more contributions like this there are, the clearer the movement's structure becomes.
With this compact representation, the model then works like an experienced analyst who knows how to read the market as a continuous data stream. What matters to the analyst is not only local spikes, but also the entire accumulated history of momentum. A specially designed spatiotemporal encoder processes this volume through a series of STSSM blocks. Each block carefully identifies the connections between adjacent moments in time, captures spatial contrasts, and assesses the overall dynamics of the scene. This is similar to the behavior of a trading system that simultaneously monitors the trend, local fluctuations, and their interaction.
At every step, the spatial and temporal dimensions of the output hypervolumes decrease, but the number of channels increases. It is as if the model compresses space and time to expand meaning. This approach is no accident. The less space there is left, the deeper the network looks. Like a trader who starts with an overview of the market and then shifts to short-term impulses to capture micro-movements. The final STSSM block preserves the spatial dimensions but condenses time into a single layer. The result is clean, two-dimensional feature maps that are rich and compact — the ideal input for the final prediction.
Now we will move on to the description of the STSSM block. This block is where the key engineering innovation of the entire architecture lies. This block works like an experienced time-series analyst who does not need cumbersome, multilevel correlation structures. Instead of traditional 4D correlation volumes that use two adjacent states, the framework's authors take a single continuous spatiotemporal array and extract correlations directly within it. Carefully, without wasting computational resources. This is reminiscent of the shift from trade volume clustering methods to modern state-space models, which read market structure from a single continuous stream.
To enable STSSM to work with such a data array, the framework's authors proposed starting with spatiotemporal patching. Video data has a convenient structure: each frame is a moment, and each moment is an image. But events — just like tick data in the market — are more complex. They may be sparse during a quiet period and dense, almost explosive, when a sharp move begins. A single time interval does not always provide the necessary context, so we create three-dimensional patches of size (m×k×k) for each of the C channels in the multimodal data array. As a result, the time axis takes on a new structure. The number of time blocks is equal to Nt = T/m. In this way, we make the data tell a more coherent story — as if the tick stream were divided into intervals not by seconds, but by meaningful chunks.
After patching, it is time for projection. Here, we need to convert each 3D patch into a neat one-dimensional vector that is suitable for sequential processing. The linear layer does this quickly and easily. It is similar to the process of converting a complex distribution of trades into a set of factors — everything superfluous is left out, leaving only an informative state vector.
However, our sequences are special. They consist of mixed spatial and temporal components, and for the model to function as an LTI system, these components must be separated along different coordinate axes. To achieve this, the framework's authors introduce temporal embeddings that precisely mark positions in time without introducing unnecessary noise. It is similar to timestamps in financial data, which allow the system to understand exactly where it stands — whether it is in a calm market or on the verge of a sharp surge. Interestingly, classical positional encoding methods turn out to be not only unnecessary here, but even harmful. The model becomes more sluggish and less stable.
Once the structure is prepared, the sequence is passed to the Seq-to-Seq transformation block. This is where Mamba comes into play — an architecture that, in recent years, has become something of a smart filter for long sequences. Similar to trading algorithms, this is like a system that does not attempt to construct a complete correlation graph between all prices, but instead updates its state linearly, step by step, while maintaining a deep understanding of the dynamics. It is here that the model learns to capture spatiotemporal relationships without 4D pyramids or expensive convolutional cascades.
Once we have obtained the output sequence, we return the data to the spatiotemporal domain. Reprojection works like reassembly: each D×1 vector is transformed into a 2D patch using a set of C kernels of size (D×l×l). It is like reconstructing the complete market picture from a set of factors: first a compact representation, then expansion back into a dense field of states.
The result is an accurate, smooth spatiotemporal representation obtained without excessive computational overhead and capable of competing with much more computationally demanding architectures. When applied to financial data, this framework will function as a lightweight yet sophisticated market analysis system that is not bogged down by historical data and correlations, but has a deep understanding of market dynamics.
Once the features have matured sufficiently, the final prediction head comes into play — a module that reconstructs a dense motion field at full resolution based on the accumulated spatiotemporal features. This resembles the final stage of market analysis, when — after a long process of compiling statistics — the system makes a definitive, clear trading forecast.
The process is straightforward: we first condense the events, then extract their dynamics, enhance the spatiotemporal patterns, and produce a final estimate. The smooth operation of the entire structure is ensured by the fact that each stage interacts with the previous one as part of a single analytical cycle. This makes the architecture natural, understandable, and stable.
The authors' visualization of the E-STMFlow framework is shown below.


Implementation in MQL5
Now that we have covered the theoretical foundations of the E-STMFlow framework, it is time to move on to the practical part. We will show how the key ideas can be implemented using MQL5. One point needs to be clarified at the outset. We are not trying to reproduce the original model exactly. Instead, we take its fundamental principles and adapt them to our own architecture, which is geared toward processing events in a spike-based format. This approach fits naturally with the specific nature of data stream analysis, where response speed, efficient use of computational resources, and the ability to extract structure from sparse signals are crucial.
We have a tremendous amount of work ahead of us. But trying to do everything at once is the wrong approach. Let's break the framework down into separate modules and implement them sequentially, step by step. This way, we maintain clarity, save time, and reduce the risk of errors.
In the first phase, we will combine the patching and embedding generation mechanisms, but we will take a slightly unconventional approach to this task. In the original model, the authors propose cutting out three-dimensional patches — like cubes that encompass the image over time. The picture is a little different with financial data. We usually deal with multimodal sequences, where each channel is simply a one-dimensional sequence of values. In this case, three-dimensional patches degenerate into simple one-dimensional vectors, and it appears that the spatial relationship between the features is lost.
Let's try to restore it. We can group features that are adjacent in the state vector into patches. But there is a catch. Proximity within the vector does not always correspond to an actual correlation between features. And this is where the magic of the E-STMFlow encoder architecture proposed by the authors comes into play. Like a convolutional network, it gradually expands its receptive field, covering the entire dataset step by step. As a result, the model sees the big picture and is able to identify relationships between features, no matter where they are located.
This means we can confidently combine elements into patches without worrying about missing anything important. Even when financial data is presented as one-dimensional sequences, the model remains capable of recognizing complex relationships, generating rich embeddings, and preparing information for subsequent stages of analysis.
The second point concerns dividing the data into patches along the time axis. The financial market never stands still; we are dealing not with a snapshot, but with a continuous event stream. In theory, we can take historical data, divide it into patches, and work with it as if it were a ready-made snapshot of the market. But in practice, we need an online analysis system that responds to every new tick or price change.
Reprocessing the entire history every time an event occurs would be extremely costly and inefficient — it is like trying to recalculate the entire trade chart every time a new quote appears. We need an approach that lets us update the analysis incrementally and carefully, without unnecessary computational overhead, while preserving an accurate and complete picture.
And here, in my opinion, using a stack seems like the most natural solution. Each new event is added to the stack, stored there for a certain amount of time, and used to generate embeddings. This means we always have an up-to-date dataset on hand for analysis.
But this immediately raises the question: why recalculate the embeddings for the entire stack whenever a single new event occurs? That is too costly and inefficient. It makes much more sense to put precomputed embeddings into the stack rather than raw data. Then, each new tick will simply add a new state vector, rather than forcing the system to reprocess the entire history. This approach makes it possible to conduct online analysis with minimal computational costs while maintaining the accuracy and completeness of the market picture.
The next question concerns how events themselves are handled. The market is full of minor fluctuations and noise, which in and of themselves do not convey any meaningful information but can significantly clutter up the analysis. How can we distinguish them from truly significant changes?
This is where a spiking system with a trainable firing threshold comes in. Each incoming signal is evaluated relative to a threshold: only events that exceed the threshold are converted into spikes and contribute to the formation of embeddings. This mechanism allows for the automatic filtering of noise while maintaining sensitivity to significant market movements. At the same time, the threshold can be adjusted during the model's training so that the system itself determines which fluctuations to take into account and which to ignore.
The result is a clean event stream, free of unnecessary noise — similar to a Renko chart, which takes into account only significant price movements. Each channel can be assigned its own step, tailored to the specifics of a particular feature. The proposed approach makes it possible to construct an accurate and compact embedding representation of a financial data stream.
As part of our work, the proposed architectural solution for handling spike events and the embedding stack has been implemented in the CNeuronSpikePatchStak class, which inherits the functionality of the base stack, CNeuronAddToStack.
class CNeuronSpikePatchStak   :  public CNeuronAddToStack
  {
protected:
   CNeuronSpikeConvBlock   cBlock;
   //---
   virtual bool      feedForward(CNeuronBaseOCL *NeuronOCL) override;
   virtual bool      updateInputWeights(CNeuronBaseOCL *NeuronOCL) override;
   virtual bool      calcInputGradients(CNeuronBaseOCL *NeuronOCL) override;

public:
                     CNeuronSpikePatchStak(void) {};
                    ~CNeuronSpikePatchStak(void) {};
   //---
   virtual bool      Init(uint numOutputs, uint myIndex, COpenCLMy *open_cl,
                          uint stack_size, uint dimension,
                          uint patch_dimension, uint variables,
                          ENUM_OPTIMIZATION optimization_type, uint batch);
   //---
   virtual int       Type(void)   override const   {  return defNeuronSpikePatchStak;   }
   //--- methods for working with files
   virtual bool      Save(int const file_handle) override;
   virtual bool      Load(int const file_handle) override;
   //---
   virtual void      SetOpenCL(COpenCLMy *obj)   override;
   //---
   virtual bool      WeightsUpdate(CNeuronBaseOCL *source, float tau) override;
  };
The class contains a key component — the spiking convolution block cBlock (CNeuronSpikeConvBlock), which is responsible for generating embeddings from patches.
As a reminder, the CNeuronSpikeConvBlock class is borrowed from the SDformerFlow framework. It consists of 3 neural layers:
- spiking activation,
- convolutional layer,
- batch normalization.
This block provides all the necessary functionality for creating informative embeddings.
In other words, CNeuronSpikeConvBlock is what transforms raw event stream data into compact yet information-rich feature vectors. By combining spiking activation and convolutional processing, the block can filter out noise, identify key relationships, and preserve an embedding structure suitable for subsequent STSSM blocks. This approach allows us to build high-quality representations of data without losing important market dynamics and while maintaining computational efficiency.
The Init method is used to initialize the class; it sets all the necessary parameters for the embedding stack and spiking block to function correctly.
bool CNeuronSpikePatchStak::Init(uint numOutputs, uint myIndex, COpenCLMy *open_cl,
                                 uint stack_size, uint dimension,
                                 uint patch_dimension, uint variables,
                                 ENUM_OPTIMIZATION optimization_type, uint batch)
  {
   if(!CNeuronAddToStack::Init(numOutputs, myIndex, open_cl, stack_size, patch_dimension,
                                                    variables, optimization_type, batch))
      return false;
   if(!cBlock.Init(0, 0, OpenCL, dimension, dimension, patch_dimension, variables, 1,
                                                                   optimization, iBatch))
      return false;
//---
   return true;
  }
First, the parent class method of the same name is called to set the stack size and optimization parameters. If this step is successful, the nested block cBlock, which is responsible for generating embeddings, is initialized. It receives the input and output dimensions, as well as the patch and variable parameters.
Thus, the initialization method ensures that the stack and the spiking convolution block are fully ready for use. If any initialization error occurs, false is returned, allowing the configuration to be reliably validated before training or data processing begins.
The forward pass algorithm is implemented in the feedForward method. First, the forward pass of the nested block cBlock is executed; this block processes incoming event stream data and generates embeddings. If this step is successful, the result is passed to the parent class CNeuronAddToStack, where the embedding stack is updated.
bool CNeuronSpikePatchStak::feedForward(CNeuronBaseOCL *NeuronOCL)
  {
   if(!cBlock.FeedForward(NeuronOCL))
      return false;
//---
   return CNeuronAddToStack::feedForward(cBlock.AsObject());
  }
This approach allows the model to effectively process event streams, minimizing computational costs while ensuring that the data remains up-to-date for online market analysis.
As a result, CNeuronSpikePatchStak serves as the core of our online event stream analysis system, carefully combining patches, filtering out noise, and maintaining a stack of embeddings for subsequent processing in STSSM blocks.
We've worked hard and deserve a little rest. In the next article, we will continue our work by delving deeper into embedding processing and building a complete STSSM pipeline for analyzing financial events.
Conclusion
In this article, we were introduced to the E-STMFlow framework and began adapting it for the analysis of financial data streams. The main advantage of this approach is its ability to efficiently process spike events online, extracting informative embeddings from data streams with high temporal and spatial resolution.
Using a stack of embeddings and spiking mechanisms with a learnable threshold allows us to filter out noise and focus on meaningful market changes while maintaining computational efficiency. The encoder's architecture enables the analysis of complex relationships between features, even when the input data consists of one-dimensional time series.
Ultimately, E-STMFlow offers a versatile and scalable solution for building models capable of identifying hidden patterns and dynamics in the financial market. This framework opens up new possibilities for online forecasting, automated analysis, and the development of intelligent trading systems, combining accuracy, efficiency, and flexibility in processing complex data streams.
Links
- Spatio-Temporal State Space Model for Efficient Event-Based Optical Flow
- Other articles in this series
Software used in this article
| # | Name | Type | Description |
|---|---|---|---|
| 1 | Study.mq5 | Expert Advisor | Expert Advisor for offline model training |
| 2 | StudyOnline.mq5 | Expert Advisor | Online model training Expert Advisor |
| 3 | Test.mq5 | Expert Advisor | Model testing Expert Advisor |
| 4 | Trajectory.mqh | Class library | Structure describing the system state and model architectures |
| 5 | NeuroNet.mqh | Class library | Class library for building a neural network |
| 6 | NeuroNet.cl | Library | Code library for an OpenCL program |
Translated from Russian by MetaQuotes Ltd.
Original article: https://www.mql5.com/ru/articles/20421
Warning: All rights to these materials are reserved by MetaQuotes Ltd. Copying or reprinting of these materials in whole or in part is prohibited.
This article was written by a user of the site and reflects their personal views. MetaQuotes Ltd is not responsible for the accuracy of the information presented, nor for any consequences resulting from the use of the solutions, strategies or recommendations described.