
Analytical Volume Profile Trading (AVPT): Liquidity Architecture, Market Memory, and Algorithmic Execution

Table of contents:
Introduction
With institutional order flow constantly redrawing the landscape of liquidity, traders must rely on methods that map the underlying structure of participation rather than the noise of price alone. Analytical Volume Profile Trading (AVPT) goes far beyond simple indicators by dissecting where the market actually traded, not just where it moved. Through the interplay of High-Volume Nodes, Low-Volume Nodes, Value Areas, and the all-important Point of Control, AVPT exposes the hidden layers of market memory—showing exactly where institutions agreed, disagreed, and positioned themselves.
As algorithmic trading increasingly dominates global markets, understanding the distribution of volume across price levels becomes a decisive edge. AVPT combines microstructure analysis with automation, allowing traders to interpret liquidity imbalances in real time and execute with surgical precision. By turning raw volume into actionable structure, this approach transforms chaotic market activity into a readable blueprint for trend detection, breakout anticipation, and reversal timing.
System Overview and Understanding
Key Components of Volume Profile:
| Component | Description |
|---|---|
| Point of Control (POC) | The price level with the highest trading volume, often acting as a pivot point for price action. |
| High-Value Node (HVN) | Price levels where significant trading activity occurs, indicating strong support or resistance. |
| Low-Value Node (LVN) | Price levels with minimal trading activity, where prices can move quickly due to low liquidity. |
| Value Area | The range of price levels where a specified percentage (usually 70%) of volume was traded. |
Analytical Volume Profile Trading (AVPT) represents a sophisticated approach to market analysis that moves beyond traditional price-based technical indicators by focusing on the crucial dimension of trading volume at specific price levels. At its core, AVPT visualizes the market as a dynamic landscape where price action interacts with volume-based support and resistance zones. The Volume Profile histogram, typically displayed as a horizontal histogram on the right side of the chart, reveals where significant trading activity occurred during a specified period. This visualization creates a clear map of market consensus, showing price levels where institutions and large traders accumulated positions (High-Volume Nodes) versus areas of minimal participation (Low-Volume Nodes). The Point of Control (POC) acts as the gravitational center of this landscape, representing the price level with the highest trading volume and often serving as a powerful magnet for price returns.
The strategic framework of AVPT revolves around understanding how price interacts with these volume-based structures. When price approaches High-Volume Nodes, it typically encounters strong support or resistance, as these zones represent areas of significant institutional interest and liquidity. Conversely, Low-Volume Nodes function as acceleration zones where price can move rapidly due to the absence of meaningful trading interest. The Value Area encompassing approximately 70% of the period's volume, defines the "fair value" range where most trading occurred. Visualizing these components creates a comprehensive trading roadmap: traders can identify potential reversal zones near value boundaries, breakout opportunities through low-volume areas, and profit targets at the POC. This three-dimensional view of the market—combining price, volume, and time—provides a significant edge over traditional two-dimensional price analysis.
The practical implementation of AVPT involves monitoring how current price action relates to these established volume structures. In ranging markets, traders might employ mean-reversion strategies, buying near the Value Area Low with stops below nearby LVNs and taking profits at the POC. During trending conditions, breakout strategies become viable when price moves through LVN zones with momentum, targeting extensions beyond the Value Area. The visualization makes risk management particularly intuitive—stop losses naturally belong beyond LVNs where breakouts would invalidate the trade premise, while position sizing can adapt based on the width of the Value Area and distance to key volume nodes. This integrated approach to analysis, entry timing, and risk management creates a systematic methodology that aligns with how institutional money flows actually shape market movements.

Getting Started
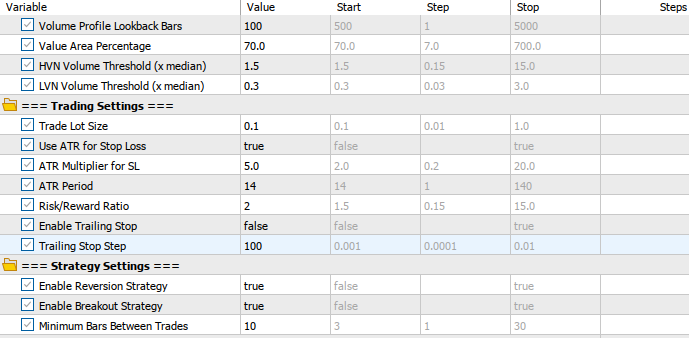
//+------------------------------------------------------------------+
//|                                                         AVPT.mq5 |
//|                        GIT under Copyright 2025, MetaQuotes Ltd. |
//|                     https://www.mql5.com/en/users/johnhlomohang/ |
//+------------------------------------------------------------------+
#property copyright "GIT under Copyright 2025, MetaQuotes Ltd."
#property link      "https://www.mql5.com/en/users/johnhlomohang/"
#property version   "1.00"
#include <Trade/Trade.mqh>


//+------------------------------------------------------------------+
//| Input Parameters                                                 |
//+------------------------------------------------------------------+
input group "=== Volume Profile Settings ==="
input int      VP_LookbackBars = 500;        // Volume Profile Lookback Bars
input double   VA_Percentage = 70.0;         // Value Area Percentage
input double   HVN_Threshold = 1.5;          // HVN Volume Threshold (x median)
input double   LVN_Threshold = 0.3;          // LVN Volume Threshold (x median)

input group "=== Trading Settings ==="
input double   LotSize = 0.1;                // Trade Lot Size
input bool     UseAtrSL = true;              // Use ATR for Stop Loss
input double   AtrMultiplier = 2.0;          // ATR Multiplier for SL
input int      AtrPeriod = 14;               // ATR Period
input double   RiskRewardRatio = 1.5;        // Risk/Reward Ratio
input bool     UseTrailingStop = true;       // Enable Trailing Stop
input double   TrailingStep = 0.0010;        // Trailing Stop Step

input group "=== Strategy Settings ==="
input bool     EnableReversion = true;       // Enable Reversion Strategy
input bool     EnableBreakout = false;       // Enable Breakout Strategy
input int      MinBarsBetweenTrades = 3;     // Minimum Bars Between Trades
We start by defining all the configurable inputs that shape how the Volume Profile engine and trading logic operate. The first group specifies profile-related parameters such as the number of lookback bars to analyze, the percentage used to compute the Value Area, and thresholds for identifying High-Volume Nodes and Low-Volume Nodes. The trading settings section then establishes risk and position-management controls—including lot size, ATR-based stop loss, risk-reward ratio, and trailing-stop behavior—giving the EA flexibility in adapting to volatility. Finally, the strategy settings group enables or disables key AVPT modes like reversion or breakout trading while enforcing a minimum spacing between trades for cleaner execution and reduced signal noise.
//+------------------------------------------------------------------+
//| Enumerations                                                     |
//+------------------------------------------------------------------+
enum ENUM_LEVEL_POSITION{
   BELOW,
   ABOVE
};

enum ENUM_DIRECTION{
   UP,
   DOWN
};

//+------------------------------------------------------------------+
//| Global Variables                                                 |
//+------------------------------------------------------------------+
CTrade trade;

// Volume Profile Arrays
double volumeProfile[];
double priceLevels[];
int profileBins;

// Key Levels
double pocPrice;
double vahPrice;
double valPrice;
double hvnLevels[];
double lvnLevels[];

// Trading
datetime lastTradeTime;
int atrHandle;
double currentAtr;
We then define essential enumerations and global variables that support the EA’s logic and data structures. The enum provide clear directional and positional classifications used throughout the strategy, while the global variables store core trading components such as the CTrade object, the dynamically built Volume Profile arrays, and key levels like POC, VAH, VAL, HVNs, and LVNs. Additional variables track trading logistics—including the timestamp of the last executed trade—and maintain access to indicators like ATR, ensuring the EA can reference volatility data in real time for stop-loss and risk management decisions.
//+------------------------------------------------------------------+
//| Expert initialization function                                   |
//+------------------------------------------------------------------+
int OnInit()
{
    // Initialize ATR indicator
    atrHandle = iATR(_Symbol, _Period, AtrPeriod);
    if(atrHandle == INVALID_HANDLE)
    {
        Print("Error creating ATR indicator");
        return(INIT_FAILED);
    }

    // Initialize volume profile arrays
    InitializeVolumeProfile();

    // Set up timer for periodic updates
    EventSetTimer(60); // Update every minute

    return(INIT_SUCCEEDED);
}

//+------------------------------------------------------------------+
//| Expert deinitialization function                                 |
//+------------------------------------------------------------------+
void OnDeinit(const int reason)
{
    IndicatorRelease(atrHandle);
    EventKillTimer();
    CleanUpChartObjects();
}
In the initialization phase, the EA sets up all essential components by first creating the ATR indicator used for volatility-based stop-loss calculations and validating that it loads correctly. It then prepares the volume profile arrays through a dedicated initialization function and establishes a repeating timer so the system can update its profile and logic every minute. During deinitialization, the EA safely releases the ATR indicator, stops the timer, and removes any chart objects created during execution to ensure a clean shutdown and prevent resource leaks.
//+------------------------------------------------------------------+
//| Expert tick function                                             |
//+------------------------------------------------------------------+
void OnTick()
{
    // Update ATR value
    UpdateAtrValue();

    // Update volume profile every new bar
    if(IsNewBar())
    {
        UpdateVolumeProfile();
        CalculateKeyLevels();
        UpdateChartObjects();

        // Check for trading signals
        CheckTradingSignals();
    }

    // Manage open positions
    ManagePositions();
}

//+------------------------------------------------------------------+
//| Volume Profile Engine                                           |
//+------------------------------------------------------------------+
void InitializeVolumeProfile()
{
    profileBins = 200; // Number of price bins
    ArrayResize(volumeProfile, profileBins);
    ArrayResize(priceLevels, profileBins);
    ArrayInitialize(volumeProfile, 0);
}
In the main execution loop, the EA continuously updates the ATR value on every tick to maintain accurate volatility metrics. When a new bar forms, it triggers core processing steps: refreshing the volume profile, recalculating key levels such as POC and Value Area boundaries, and updating the visual objects on the chart. After the structural analysis is refreshed, the EA evaluates whether any trade conditions are met based on the latest Volume Profile signals, and then separately manages all currently open positions to ensure stops, trailing logic, and exits evolve with market conditions.
The Volume Profile engine begins by initializing the data structure that will store the distribution of traded volume across price levels. By defining a fixed number of bins and resizing arrays accordingly, the EA prepares a clean container for gathering volume data during runtime. This ensures that each new bar can be mapped into a consistent volume histogram, enabling accurate detection of key levels like HVNs, LVNs, and the Point of Control later in the process.
void UpdateVolumeProfile()
{
    // Clear previous profile
    ArrayInitialize(volumeProfile, 0);

    // Get price range for current lookback
    double highPrice = GetHighestPrice(VP_LookbackBars);
    double lowPrice = GetLowestPrice(VP_LookbackBars);
    double priceRange = highPrice - lowPrice;
    double binSize = priceRange / profileBins;

    // Initialize price levels
    for(int i = 0; i < profileBins; i++)
    {
        priceLevels[i] = lowPrice + (i * binSize);
    }

    // Distribute volume across price bins
    for(int bar = 0; bar < VP_LookbackBars; bar++)
    {
        double open = iOpen(_Symbol, _Period, bar);
        double high = iHigh(_Symbol, _Period, bar);
        double low = iLow(_Symbol, _Period, bar);
        double close = iClose(_Symbol, _Period, bar);
        long volume = iVolume(_Symbol, _Period, bar);

        DistributeVolumeToBins(open, high, low, close, volume, lowPrice, binSize);
    }
}

void DistributeVolumeToBins(double open, double high, double low, double close,
                           long volume, double basePrice, double binSize)
{
    double bodyLow = MathMin(open, close);
    double bodyHigh = MathMax(open, close);

    for(int i = 0; i < profileBins; i++)
    {
        double binLow = basePrice + (i * binSize);
        double binHigh = binLow + binSize;

        // Check if price bin was touched by this candle
        if(!(high < binLow || low > binHigh))
        {
            // Weight volume by time spent in price zone (simplified)
            double overlap = MathMin(high, binHigh) - MathMax(low, binLow);
            double candleRange = high - low;

            if(candleRange > 0)
            {
                double weight = overlap / candleRange;
                // Additional weight for body area
                if(binLow <= bodyHigh && binHigh >= bodyLow)
                {
                    double bodyOverlap = MathMin(bodyHigh, binHigh) - MathMax(bodyLow, binLow);
                    weight += (bodyOverlap / candleRange) * 0.3;
                }

                volumeProfile[i] += volume * weight;
            }
        }
    }
}
The UpdateVolumeProfile() function rebuilds the entire volume distribution for the defined lookback window by first resetting the histogram and then determining the price range that needs to be profiled. It calculates bin size based on this range and initializes each price level that corresponds to a volume bin. After establishing these structural boundaries, it iterates through the historical bars within the lookback period, extracting each candle’s OHLC values and volume before passing them into the distribution engine. This ensures that the profile always reflects the most recent and relevant activity within the market.
The DistributeVolumeToBins() function performs the core logic of allocating candle volume to the appropriate price bins. For each bin, it checks whether the candle’s range interacted with it, and if so, estimates how much trading activity likely occurred within that price zone. This estimation uses a weighted method based on the proportional overlap between the bin and the candle’s high–low range, while giving additional emphasis to the candle’s body, where more concentrated trading typically happens. By accumulating these weighted contributions, the EA produces a more realistic and detailed Volume Profile that captures institutional footprints across the price ladder.
//+------------------------------------------------------------------+
//| Key Levels Calculation                                           |
//+------------------------------------------------------------------+
void CalculateKeyLevels()
{
    CalculatePOC();
    CalculateValueArea();
    CalculateHVNLVN();
}

void CalculatePOC()
{
    double maxVolume = 0;
    int pocIndex = 0;

    for(int i = 0; i < profileBins; i++)
    {
        if(volumeProfile[i] > maxVolume)
        {
            maxVolume = volumeProfile[i];
            pocIndex = i;
        }
    }

    pocPrice = priceLevels[pocIndex];
}

void CalculateValueArea()
{
    double totalVolume = 0;
    for(int i = 0; i < profileBins; i++)
    {
        totalVolume += volumeProfile[i];
    }

    double targetVolume = totalVolume * (VA_Percentage / 100.0);
    int pocIndex = FindPriceIndex(pocPrice);

    double currentVolume = volumeProfile[pocIndex];
    int upperIndex = pocIndex;
    int lowerIndex = pocIndex;

    while(currentVolume < targetVolume && (upperIndex < profileBins - 1 || lowerIndex > 0))
    {
        bool canExpandUp = (upperIndex < profileBins - 1);
        bool canExpandDown = (lowerIndex > 0);

        double upVolume = canExpandUp ? volumeProfile[upperIndex + 1] : 0;
        double downVolume = canExpandDown ? volumeProfile[lowerIndex - 1] : 0;

        if(upVolume > downVolume && canExpandUp)
        {
            upperIndex++;
            currentVolume += upVolume;
        }
        else if(canExpandDown)
        {
            lowerIndex--;
            currentVolume += downVolume;
        }
        else if(canExpandUp)
        {
            upperIndex++;
            currentVolume += upVolume;
        }
    }

    vahPrice = priceLevels[upperIndex];
    valPrice = priceLevels[lowerIndex];
}

void CalculateHVNLVN()
{
    ArrayResize(hvnLevels, 0);
    ArrayResize(lvnLevels, 0);

    // Calculate median volume
    double tempVolumes[];
    ArrayCopy(tempVolumes, volumeProfile);
    ArraySort(tempVolumes);
    double medianVolume = tempVolumes[profileBins / 2];

    double hvnThreshold = medianVolume * HVN_Threshold;
    double lvnThreshold = medianVolume * LVN_Threshold;

    for(int i = 0; i < profileBins; i++)
    {
        if(volumeProfile[i] >= hvnThreshold)
        {
            int size = ArraySize(hvnLevels);
            ArrayResize(hvnLevels, size + 1);
            hvnLevels[size] = priceLevels[i];
        }
        else if(volumeProfile[i] <= lvnThreshold && volumeProfile[i] > 0)
        {
            int size = ArraySize(lvnLevels);
            ArrayResize(lvnLevels, size + 1);
            lvnLevels[size] = priceLevels[i];
        }
    }
}
The key-level calculation engine begins by orchestrating the three core components of the Volume Profile: determining the Point of Control, computing the Value Area boundaries, and identifying High-Volume Nodes and Low-Volume Nodes. This modular approach allows each method to focus on a specific structural element, ensuring that the EA maintains an accurate and clean hierarchy of liquidity levels. By separating the logic, the system remains easy to debug, extend, and optimize as new strategies or filters are added.
The POC and Value Area calculations work together to define the market’s center of gravity. The POC is located by scanning the volume histogram for the price bin with the highest traded volume, reflecting the level of maximum market acceptance. The Value Area is then built outward from that POC by accumulating volume in both directions until the cumulative total reaches the specified percentage. This expansion logic prioritizes price levels with higher volume, allowing the EA to define the Value Area High (VAH) and Value Area Low (VAL) as boundaries that represent the region where most trading activity occurred.
Finally, the HVN/LVN calculation identifies zones of exceptionally high and unusually low participation relative to the median volume. After computing the median from a sorted copy of the profile, the EA applies user-defined multipliers to detect meaningful clusters (HVNs) and rejection zones (LVNs). HVNs represent strong acceptance where price tends to pause, stall, or reverse, while LVNs highlight low-liquidity pockets where price often accelerates or breaks out. Collectively, these levels anchor the EA’s decision-making, enabling adaptive strategies rooted in liquidity structure and market memory.
//+------------------------------------------------------------------+
//| Trading Signal Logic                                             |
//+------------------------------------------------------------------+
void CheckTradingSignals()
{
    if(!IsTradeAllowed()) return;

    // Check minimum bars between trades
    if(Bars(_Symbol, _Period, lastTradeTime, TimeCurrent()) < MinBarsBetweenTrades)
        return;

    double currentPrice = SymbolInfoDouble(_Symbol, SYMBOL_LAST);

    if(EnableReversion)
    {
        CheckReversionSignals(currentPrice);
    }

    if(EnableBreakout)
    {
        CheckBreakoutSignals(currentPrice);
    }
}

void CheckReversionSignals(double currentPrice)
{
    MqlRates currentRates[];
    CopyRates(_Symbol, _Period, 0, 3, currentRates);

    // Buy signal: Price rejects VAL with bullish confirmation
    if(IsNearLevel(currentPrice, valPrice) &&
       IsBullishRejection(currentRates))
    {
        double sl = FindNearestLVN(BELOW);
        double tp = pocPrice;
        OpenTrade(ORDER_TYPE_BUY, sl, tp);
    }

    // Sell signal: Price rejects VAH with bearish confirmation
    if(IsNearLevel(currentPrice, vahPrice) &&
       IsBearishRejection(currentRates))
    {
        double sl = FindNearestLVN(ABOVE);
        double tp = pocPrice;
        OpenTrade(ORDER_TYPE_SELL, sl, tp);
    }
}

void CheckBreakoutSignals(double currentPrice)
{
    // Breakout above VAH with confirmation
    if(currentPrice > vahPrice && IsBreakoutConfirmed(UP))
    {
        double sl = FindNearestHVN(BELOW);
        double tp = CalculateBreakoutTP(UP);
        OpenTrade(ORDER_TYPE_BUY, sl, tp);
    }

    // Breakout below VAL with confirmation
    if(currentPrice < valPrice && IsBreakoutConfirmed(DOWN))
    {
        double sl = FindNearestHVN(ABOVE);
        double tp = CalculateBreakoutTP(DOWN);
        OpenTrade(ORDER_TYPE_SELL, sl, tp);
    }
}
The trading signal logic then ensures that the conditions are suitable for execution—confirming trading is allowed, verifying enough bars have passed since the last trade, and capturing the current market price. Once these safeguards are met, the EA evaluates which strategy modes are enabled and routes the price action through the appropriate logic blocks. If the reversion model is active, the EA checks whether price is interacting with Value Area boundaries in a way that suggests rejection; if the breakout model is active, it looks for decisive moves beyond value levels supported by structural confirmation.
Within each strategy, the EA performs more detailed checks to validate trade setups. For reversions, it looks for bullish or bearish rejection patterns near the VAL or VAH, then calculates stop-loss and take-profit levels using the nearest LVNs and the POC as a natural magnet. For breakouts, the logic confirms that price has cleanly moved beyond VAH or VAL, then uses nearby HVNs as protective stops and computes directional targets based on breakout strength. This layered structure ensures signals are rooted in the liquidity architecture defined by the Volume Profile, producing trades that align with both market structure and volume-based context.
//+------------------------------------------------------------------+
//| Trade Execution & Risk Management                                |
//+------------------------------------------------------------------+
void OpenTrade(ENUM_ORDER_TYPE type, double sl, double tp)
{
    double price = (type == ORDER_TYPE_BUY) ? SymbolInfoDouble(_Symbol, SYMBOL_ASK)
                                           : SymbolInfoDouble(_Symbol, SYMBOL_BID);

    if(UseAtrSL)
    {
        double atrSl = currentAtr * AtrMultiplier;
        sl = (type == ORDER_TYPE_BUY) ? price - atrSl : price + atrSl;

        // Calculate TP based on risk/reward
        double risk = MathAbs(price - sl);
        tp = (type == ORDER_TYPE_BUY) ? price + (risk * RiskRewardRatio)
                                     : price - (risk * RiskRewardRatio);
    }

    // Execute trade using CTrade
    if(trade.PositionOpen(_Symbol, type, LotSize, price, sl, tp, "VolumeProfileEA"))
    {
        lastTradeTime = iTime(_Symbol, _Period, 0);
        Print("Trade executed: ", EnumToString(type), " Price: ", price, " SL: ", sl, " TP: ", tp);
    }
    else
    {
        Print("Trade failed: ", trade.ResultRetcodeDescription());
    }
}

void ManagePositions()
{
    for(int i = PositionsTotal() - 1; i >= 0; i--)
    {
        ulong ticket = PositionGetTicket(i);
        if(PositionSelectByTicket(ticket) && PositionGetString(POSITION_COMMENT) == "VolumeProfileEA")
        {
            if(UseTrailingStop)
            {
                ApplyTrailingStop(ticket);
            }

            // Check exit condition: price re-enters Value Area
            if(ShouldExitEarly(ticket))
            {
                ClosePosition(ticket);
            }
        }
    }
}

void ApplyTrailingStop(ulong ticket)
{
    if(PositionSelectByTicket(ticket))
    {
        double currentPrice = SymbolInfoDouble(_Symbol, SYMBOL_LAST);
        double currentSL = PositionGetDouble(POSITION_SL);
        ENUM_POSITION_TYPE type = (ENUM_POSITION_TYPE)PositionGetInteger(POSITION_TYPE);

        double newSL = currentSL;
        double point = SymbolInfoDouble(_Symbol, SYMBOL_POINT);

        if(type == POSITION_TYPE_BUY)
        {
            newSL = currentPrice - (currentAtr * TrailingStep);
            if(newSL > currentSL + point && newSL < currentPrice - point)
            {
                if(trade.PositionModify(ticket, newSL, PositionGetDouble(POSITION_TP)))
                {
                    Print("Trailing SL updated for BUY: ", newSL);
                }
            }
        }
        else if(type == POSITION_TYPE_SELL)
        {
            newSL = currentPrice + (currentAtr * TrailingStep);
            if(newSL < currentSL - point && newSL > currentPrice + point)
            {
                if(trade.PositionModify(ticket, newSL, PositionGetDouble(POSITION_TP)))
                {
                    Print("Trailing SL updated for SELL: ", newSL);
                }
            }
        }
    }
}

void ClosePosition(ulong ticket)
{
    if(PositionSelectByTicket(ticket))
    {
        ENUM_POSITION_TYPE type = (ENUM_POSITION_TYPE)PositionGetInteger(POSITION_TYPE);
        double volume = PositionGetDouble(POSITION_VOLUME);

        if(type == POSITION_TYPE_BUY)
        {
            trade.PositionClose(ticket);
        }
        else if(type == POSITION_TYPE_SELL)
        {
            trade.PositionClose(ticket);
        }

        Print("Position closed early: ", ticket);
    }
}
The trade execution logic begins by constructing a clean, risk-controlled order based on the signal type, current market price, and dynamic volatility conditions. If ATR-based stop-loss is enabled, the EA recalculates both SL and TP using the ATR multiplier and the configured risk-reward ratio, ensuring every position adapts to current volatility instead of relying on fixed distances. Once the final parameters are set, the EA uses the CTrade object to send the order to the server and logs whether the execution succeeded or failed. This structured workflow ensures trades are entered with consistent sizing, volatility-aligned protection, and logical profit targets rooted in the strategy’s architecture.
The position-management engine then supervises all active VolumeProfileEA trades, applying dynamic trailing stops and evaluating whether early exits are necessary. The trailing stop adjusts itself using ATR-based movement, allowing the stop-loss to track price efficiently without choking the trade too early. Meanwhile, early-exit logic monitors whether price re-enters the Value Area—indicating that the original trade thesis may be weakening—and closes the position to preserve capital. This two-layer exit system, combining trailing logic with structural invalidation checks, ensures that each position evolves intelligently with market conditions while limiting risk and locking in profits.
Back Test Results
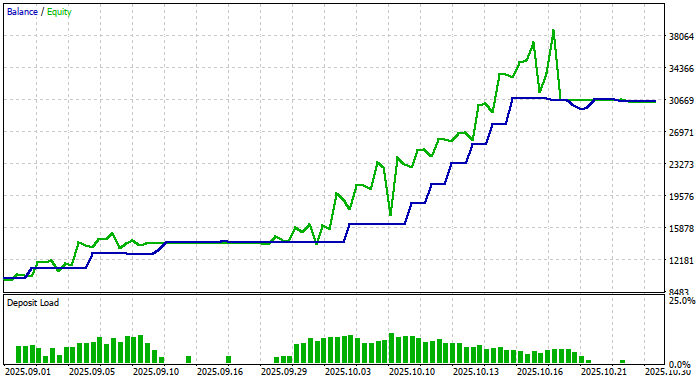
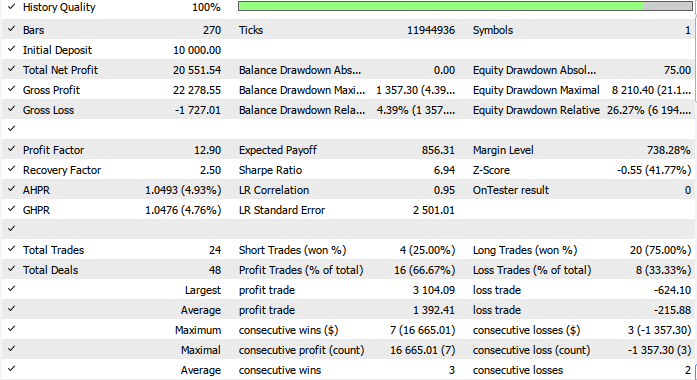
The back-testing was evaluated on the H4 timeframe across roughly a 2-month testing window (01 September 2025 to 03 November 2025), with the following settings:
Now here is the equity curve and the backtest results:
Conclusion
In summary, we developed Analytical Volume Profile Trading (AVPT) by breaking down how liquidity architecture, volume distribution, and market memory shape the true structure behind price movements. We explored how volume nodes, high-liquidity shelves, and low-volume inefficiencies form a repeatable blueprint of where markets pause, expand, or reverse. We then translated this structural logic into algorithmic execution—mapping how an EA can read volume profile zones, anticipate liquidity events, and align entries with the deepest institutional footprints rather than surface-level price action.
In conclusion, AVPT gives traders a more intelligent and context-aware approach to execution: trades are no longer triggered solely by patterns or indicators, but by understanding where real liquidity sits and how markets “remember” past imbalances. By integrating market memory, volume clustering, and algorithmic decision-making, traders gain a framework that improves precision, enhances risk placement, and reduces noise-driven signals.
Warning: All rights to these materials are reserved by MetaQuotes Ltd. Copying or reprinting of these materials in whole or in part is prohibited.
This article was written by a user of the site and reflects their personal views. MetaQuotes Ltd is not responsible for the accuracy of the information presented, nor for any consequences resulting from the use of the solutions, strategies or recommendations described.

- Free trading apps
- Over 8,000 signals for copying
- Economic news for exploring financial markets
You agree to website policy and terms of use
Hello Hlomohang John Borotho, Thank you for your article — it was very interesting. In return, I’d like to share with you and the community an indicator version of your AVPT EA, which I developed with a bit of assistance. Here is the source code attached.
How to use the indicator ?
Thank you again. Together as a community, we are smarter!
Thanks for the indicator Cédric Olivier.
What an epic Article and Discussion... and all within only 3 days of time.
@Hlomohang John Borotho, Thank you.
@Cédric Olivier, Thank you.
I wouldn't really worry about the symbol tested. FYI, it likely wasn't a security in the technical sense of the word because iRealVolume() is excluded from the code. The code uses iVolume() which returns the same values as iTickVolume()--these are generally used for OTC markets, e.g., FX, CFD's, etc.
Interesting approach but would appreciate if you had identified the security that the backtest was performed against in order to validate the results presented.
Hey, the symbol tested is XAUUSD, and please refer to the testing period and settings used to achieve the same results.
Is there an EA for this I can download and use?I'm not a coder
It's at the end of the Article that is linked up top in this Discussion:
Analytical Volume Profile Trading (AVPT): Liquidity Architecture, Market Memory, and Algorithmic Execution
(This is how all Article Discussions automatically posted in the Forum work.)