
Price Action Analysis Toolkit Development (Part 40): Market DNA Passport

Contents
Introduction
In biology, deoxyribonucleic acid (DNA) is the molecule that encodes the genetic blueprint unique to every organism. DNA defines biological identity and is passed down through generations. I once watched a case in which a man denied paternity until a DNA test—performed after the child’s birth—proved he was indeed the father. You may wonder how that relates to price-action analysis: the connection is the idea of a persistent, identifiable fingerprint.
In my research I found that each currency pair exhibits its own characteristic price-action signature. Some pairs can behave similarly under shared influences (for example, EURUSD and GBPUSD), while others show distinct behavior. To capture these patterns, I created an automated system that scans each instrument and produces a Market DNA—a compact fingerprint derived from volatility, fractal structure, session rhythms, and retracement behavior. The Market DNA Passport quantifies those traits, allowing you to compare instruments, detect structural shifts (mutations), and select or adapt strategies to prevailing market regimes.
A mutation is a significant change in the EA’s market fingerprint, flagged when the cosine or normalized L2 distance between the previous and current DNAMetrics exceeds the set thresholds—and usually means a regime shift (e.g., ATR, spikes, session dominance, or retracement behavior changed). Treat it as an early warning: inspect which metrics moved, tighten or pause execution (smaller size, wider ATR stops, higher signal threshold), and validate the new profile with a few recalculations or paper trading before resuming live trades.
// Show top N metric changes when a mutation is detected.
// Call: ShowMutationDetails(gDNA_prev, gDNA, 3);
void ShowMutationDetails(const DNAMetrics &prev_in, const DNAMetrics &cur_in, int topN=3)
{
   // make local copies because DNAVector expects a non-const reference
   DNAMetrics prev = prev_in;
   DNAMetrics cur  = cur_in;

   // metric names must follow the order in DNAVector()
   string names[] = {
     "wick_body_ratio_avg",
     "pct_close_near_high",
     "pct_close_near_low",
     "pct_doji",
     "atr_norm",
     "pct_spikes",
     "vol_clustering",
     "swing_cycle_bars_avg",
     "fractal_density",
     "breakout_follow_through",
     "retr_38_freq",
     "retr_50_freq",
     "retr_62_freq",
     "asia_range_share",
     "london_range_share",
     "ny_range_share",
     "smoothness_index"
   };

   double va[], vb[];
   DNAVector(cur, va);
   DNAVector(prev, vb);

   int n = ArraySize(va);
   if(n != ArraySize(names))
   {
      Print("[ShowMutationDetails] vector/name-size mismatch");
      return;
   }

   // diffs and indices
   double diffs[]; int idxs[];
   ArrayResize(diffs, n);
   ArrayResize(idxs, n);
   for(int i=0; i<n; ++i) { diffs[i] = va[i] - vb[i]; idxs[i] = i; }

   // simple selection sort by absolute diff (descending)
   for(int i=0; i<n-1; ++i)
   {
      int best = i;
      for(int j=i+1; j<n; ++j)
         if(MathAbs(diffs[j]) > MathAbs(diffs[best])) best = j;

      // swap diffs
      double td = diffs[i]; diffs[i] = diffs[best]; diffs[best] = td;
      int ti = idxs[i]; idxs[i] = idxs[best]; idxs[best] = ti;
   }

   int show = MathMin(topN, n);
   string out = "";
   for(int k=0; k<show; ++k)
   {
      int id = idxs[k];
      double d = diffs[k];
      double prevVal = vb[id];
      double pct = (MathAbs(prevVal) < 1e-12 ? 0.0 : (d / MathAbs(prevVal) * 100.0));
      string sign = (d >= 0.0 ? "+" : "-");
      string line = StringFormat("%d) %s %s%.4f (%.1f%%)", k+1, names[id], sign, MathAbs(d), MathAbs(pct));
      out += line + "\\n";
      PrintFormat("[MarketDNA][Mutation] %s", line);
   }

   // show on-panel (adjust offsets/sizes if needed)
   int w = 360;
   int h = 18 * (show + 1);
   CreateOrSetRect("mut_detail_bg", InpCorner, InpX + 380, InpY + 340, w, h, BgColor());
   CreateOrSetLabel("mut_detail_lbl", InpCorner, InpX + 388, InpY + 344, SafeText(out, 800), 9, MakeColor(200,120,40));
}
In the sections that follow, I describe the metrics used, the MQL5 implementation, and practical examples demonstrating how the passport supports robust analysis.
Conceptual Metrics
Market DNA Passport compresses hundreds of bars of raw price action into stable, explainable metrics—spikes, fractal swings, retracement frequencies, ATR-normalized volatility, session range shares, smoothness, and more—so price-action traders can see how the market is behaving structurally (not just where price is now) and make faster, more consistent decisions.
Why those metrics matter to price-action traders:
| Importance | Explanation |
|---|---|
| Objective market regime detection | Instead of guessing, “Is it trending or ranging?” the EA quantifies smoothness, fractal density, and breakout follow-through so you can switch tactics with data (trend-following vs mean-reversion). |
| Better entry bias | Metrics like breakout follow-through and close-near-high/low give high-level confirmation for price-action setups (breakout continuation vs failed-break/reversal candles). |
| Risk-aware sizing and filtering | ATR-normalized measures and spike frequency help size stops and decide when to sit out (high ATR or frequent spikes = wider stops or fewer trades). |
| Pattern validation and expectancy | Retracement histograms show how deep corrections typically are after impulses on the symbol/timeframe—essential for setting realistic targets and deciding whether a “pullback to 50%” is a probable edge. |
| Trade selection efficiency | The EA condenses a lot of pre-trade homework into an at-a-glance passport, letting you scan symbols/timeframes quickly and pick only the ones matching your price-action edge. |
| Explainability | Every signal comes with numeric reasons logged (e.g., “high follow-through + low spikes + smooth market”), so you can audit why you took a trade and improve the rule set iteratively. |
Candlestick and Volatility Analysis Metrics
1. Candlestick structure and closing
wick_body_ratio_avg — the average ratio of the total length of the shadows to the size of the candle body.
- High value → long shadows → signs of reversal (pin bar, shooting star).
- Low value → clean trend candles → steady buying/selling pressure.
- A minimum body threshold has been introduced to avoid distortions.
pct_close_near_high — percentage of candles that closed in the top 20% of the range.
- High value → strong demand, bullish bias.
- In thin markets it can give false signals.
pct_close_near_low — percentage of candles closed in the lower 20% of the range.
- High value → dominant selling pressure, bearish bias.
- Sessions with special patterns may distort the result.
pct_doji — the proportion of doji candles (body < ~10% of the range).
- High value → market uncertainty.
- Doji series can precede strong breakouts.
nearHigh_count / nearLow_count — the number of candles closed close to high/low.
- Used to assess the shift in the supply/demand balance.
doji_count — absolute number of dojis.
- Helps to see the phases of anticipation before movement.
2. Volatility and momentum
atr_mean — average ATR (absolute volatility in price units).
- Used for stops and targets.
atr_pips — ATR converted to pips.
- Convenient for unification of different tools.
atr_norm — ATR normalized to price (ATR / Close).
- Provides a relative measure of volatility.
- Very sensitive for cheap instruments.
pct_spikes — the proportion of candles where the range > ATR multiplier.
- High value → frequent pulses/noise.
spikes_count — the absolute number of impulse candles.
bigTotal_count — total number of large candles (> ATR).
bigThenBig_count - the number of times a big candle is followed by another one.
- High → volatility clusters, trending.
vol_clustering — the proportion of large candles followed by another large one.
- A measure of the persistence of increased volatility.
3. Fractals and Cycles
swing_cycle_bars_avg — the average number of bars between changes in fractal extremes.
- Length of the oscillation cycle.
- In the sideways direction it can be greatly reduced.
fractal_density — fractal density (% of candles with reversals).
- High → the market is ragged, lateral.
- Low → trendy.
sw_count — total number of fractal points.
breakout_follow_through — the proportion of fractal levels confirmed by a breakout (by ≥ ATR).
- High → breakdowns are reliable.
- Low → many false signals.
4. Corrections and rollbacks
retr_38_freq — rollback frequency is about 38%.
- Shallow corrections are typical.
retr_50_freq — frequency of 50% rollbacks (44–56%).
- Classic correction level.
retr_62_freq — frequency of deep corrections (~62%).
- Often indicates a change in volatility/regime.
retr_gt70_freq — rollback rate >70%.
- High value → weak pulses, return to range.
avg_max_retr — average maximum rollback after impulses.
- Helps set realistic stops/targets.
retr_count — the number of pulses by which rollbacks were counted (important for reliability).
5. Session activity
asia_range_share / london_range_share / ny_range_share - the share of the total range generated in the corresponding session.
- Shows which session contributes the most to the movement.
asia_range / london_range / ny_range — absolute range (High–Low) within a session.
- Characterizes volatility at a specific time of day.
6. Composite indices and service parameters
smoothness_index (0–1) — smoothness index.
- High → trendy, less noise.
- Low → sideways, jagged market.
atr_cache_used — flag for using cached ATR data (service).
sample_bars — sample size (number of bars).
- Large samples → more stable, but less sensitive to change.
MQL5 Implementation
We implement the MQL5 Market DNA engine as a compact system that reads historical bars for a chosen symbol and timeframe, computes a fingerprint of price anatomy and structure (candles, ATR, fractal swings, retracements, and session-range shares), renders a labeled on-chart “DNA passport,” optionally compares a second symbol, logs metrics and signals to CSV, and emits lightweight rule-based BUY/SELL suggestions plus mutation alerts when the fingerprint meaningfully changes. That single sentence captures the goal: the code that follows focuses on producing reproducible, explainable metrics you can inspect or feed into further analysis.
To help you navigate the implementation, this section explains the build and runtime assumptions, recommends sensible starting inputs, and highlights the key helpers and lifecycle hooks you’ll encounter in the file—for example, OnInit, OnTimer, Recalculate, BuildDNA, and DrawPassport. With those basics up front, you’ll be better prepared to follow the five-step walkthrough that follows without getting lost in details.
Before you begin, make sure your environment meets a few prerequisites. You need MetaTrader 5 with permission to compile and run EAs (#property strict and Trade/Trade.mqh are used). The EA writes to the terminal’s common files folder, so confirm file I/O is allowed. Finally, choose a symbol/timeframe with at least ~300 historical bars; 1200 bars is recommended for stable statistics. If you don’t have sufficient history, the EA will warn you, and the results will be noisy.
#property copyright "Copyright 2025, MetaQuotes Ltd."
#property link      "https://www.mql5.com/en/users/lynnchris"
#property version   "1.0"
#property strict

#include <Trade/Trade.mqh>
If you want the fastest path to try it, copy Market DNA Passport.mq5 into your MQL5/Experts folder, compile it in MetaEditor, attach the compiled EA to a chart, set InpTF and InpBars (defaults are PERIOD_H1 and 1200) and optionally enable InpLogCSV to persist metrics. The EA uses a timer and rebuilds on each new closed bar; after a short run, check Files\Common for MarketDNA_log.csv and MarketDNA_signals.csv to inspect recorded output.
A good baseline of recommended inputs is InpTF = PERIOD_H1, InpBars = 1200, InpATRPeriod = 14, InpSpikeATRMult = 2.0, InpDojiBodyPct = 0.10, InpFractalDepth = 5, InpRetrWindowBars = 50, and InpFT_ATR_Mult = 0.5. For responsiveness and moderate CPU usage, set InpRecalcSeconds = 10 and InpCacheATR = true. Treat these as starting points to tune per symbol and trading horizon.
//============================== INPUTS ==============================//
input ENUM_TIMEFRAMES InpTF              = PERIOD_H1;    // Analysis timeframe
input int              InpBars           = 1200;         // Bars to analyze (>= 300 recommended)
input int              InpATRPeriod      = 14;           // ATR period
input double           InpSpikeATRMult   = 2.0;          // Spike threshold in ATR multiples
input double           InpDojiBodyPct    = 0.10;         // Doji body <= % of candle range
input int              InpFractalDepth   = 5;            // Fractal depth (ZigZag-like swings)
input int              InpRetrLookbackSwings = 80;       // Max impulses to evaluate retracements
input int              InpRetrWindowBars = 50;           // How many bars forward to scan for retracement
input double           InpFT_ATR_Mult    = 0.5;          // Breakout follow-through threshold (in ATR multiples)
input string           InpCompareSymbol  = "";           // Optional second symbol to compare
input int              InpRecalcSeconds  = 10;           // Recalc cadence (seconds)
input int              InpCorner         = 0;            // Panel corner (0-3)
input int              InpX              = 12;           // Panel X offset
input int              InpY              = 24;           // Panel Y offset
input bool             InpDarkTheme      = true;         // Dark panel theme
input int              InpMetricPalette  = 1;            // Metric color palette (0=Warm Brown,1=DarkGray,2=NearBlack,3=Lilac,4=RichBrown,5=HighContrast)
input bool             InpAlertsOnMutation = true;       // Alert on DNA shifts
input double           InpMutationThresh = 0.12;         // Cosine distance to flag change
input double           InpMutationL2Thresh = 0.05;       // Normalized L2 change to flag mutation
input bool             InpLogCSV         = false;        // Append results to CSV in common Files folder
input string           InpCSVFileName    = "MarketDNA_log.csv"; // CSV filename (FILE_COMMON)
input bool             InpCacheATR       = true;         // Cache ATR array between runs
input bool             InpSelfTest       = false;        // Run small synthetic self-test at init
input int              InpAsiaStart      = 0;            // Session hour boundaries (server hours)
input int              InpAsiaEnd        = 7;
input int              InpLondonStart    = 8;
input int              InpLondonEnd      = 15;
input int              InpNYStart        = 16;
input int              InpNYEnd          = 23;
input bool             InpDebugRetr      = false;        // Print retracement debug lines to Experts
Practical notes on naming, safety, and performance: the EA prefixes on-chart objects with MDNA_<symbol>_<TF>_ to avoid collisions; CSVs live in the FILE_COMMON folder under fixed filenames. For safety and performance, the EA enforces a minimum timer cadence (≥5s) and avoids heavy rebuilds unless the newest closed bar changed. If you run many instances or massive lookbacks (e.g., >5k bars), increase the timer interval or reduce InpBars to limit CPU and memory use. Also note that multiple EA instances writing the same CSV may cause race conditions—for robust multi-chart logging, consider unique filenames per symbol/timeframe.
With that orientation in place, we proceed into the implementation: data acquisition and preprocessing, candle anatomy and volatility metrics, structural analysis of swings/retracements/breakouts, snapshot comparison and signal generation, and finally the UI, persistence, and lifecycle controls. Each part maps directly to functions and logical blocks in the .mq5 file so you can follow the code, reproduce results locally, and adapt the engine for your research or trading workflow
Data acquisition & preprocessing
First, we load price history using CopyRates via LoadRates(sym, tf, bars) with a safety margin so forward-looking scans (ATR windows, retracement windows) have context. We compute per-bar True Range with BarTR() and a simple SMA ATR for each index using CalcATR(r, period, idx). If InpCacheATR is enabled and stored parameters match, we reuse the global g_atrs[] cache to avoid recomputing ATRs (see the cache-check inside BuildDNA). We sanitize inputs and intermediate values with helpers such as SafeDiv, Clamp, and LTrim, convert ATR into pips/normalized units (atr_pips, atr_norm), and ensure we have a minimum bar count—if N < 300 the function flags D.valid = false and stops. The main outputs of this stage are a series array MqlRates r[] and an ATR array used downstream.
// Load rates with safety margin
bool LoadRates(string sym, ENUM_TIMEFRAMES tf, int bars, MqlRates &rates[])
{
   ArraySetAsSeries(rates, true);
   int need = MathMax(300, bars + 200); // safety margin for forward scans
   int got  = CopyRates(sym, tf, 0, need, rates);
   if(got <= 0) return false;
   return (got >= bars);
}

// True Range (series layout: 0 newest)
double BarTR(MqlRates &r[], int i)
{
   if(i >= ArraySize(r)-1) return 0.0;
   double prevC = r[i+1].close;
   double tr1 = r[i].high - r[i].low;
   double tr2 = MathAbs(r[i].high - prevC);
   double tr3 = MathAbs(r[i].low  - prevC);
   return MathMax(tr1, MathMax(tr2, tr3));
}

// Simple SMA ATR computed over 'period' TRs starting at idx
double CalcATR(MqlRates &r[], int period, int idx)
{
   double tr_sum = 0.0;
   int count = 0;
   for(int i = idx; i < idx + period && i < ArraySize(r)-1; ++i)
   {
      tr_sum += BarTR(r, i);
      ++count;
   }
   return (count > 0 ? tr_sum / count : 0.0);
}
Candle anatomy and volatility metrics
Next, we iterate the sanitized series to build candle-level descriptors and volatility counts. The loop inside BuildDNA computes an average wick-to-body ratio (wick_body_ratio_avg), counts closes near high/low (pct_close_near_high, pct_close_near_low), detects doji candles (pct_doji) using InpDojiBodyPct, and flags ATR spikes where TR > InpSpikeATRMult * atr_i. We also identify “big” ATR bars and consecutive big-then-big events to estimate vol_clustering. All per-bar accumulators are aggregated into bounded metrics and raw counts (e.g., nearHigh_count, spikes_count, bigThenBig_count) that populate the DNAMetrics struct. Those fields are intentionally clamped and normalized so they form robust building blocks for similarity comparisons and signal heuristics.
// Example loop computing candle descriptors (place inside BuildDNA after rates & atrs ready)
int nearHigh=0, nearLow=0, doji=0, spikes=0;
double wickBodyAccum = 0.0;
int bigTotal=0, bigThenBig=0;

for(int i = 0; i < N; ++i)
{
   double high = r[i].high, low = r[i].low, open = r[i].open, close = r[i].close;
   double range = high - low;
   if(range <= 0.0) continue;

   double body = MathAbs(close - open);
   if(body < 1e-9) body = 1e-9;
   double upper = (close >= open ? high - close : high - open);
   double lower = (close >= open ? open - low : close - low);

   double minBody = MathMax(body, range * 0.02); // floor to avoid tiny-body noise
   double wickRatio = (upper + lower) / minBody;
   wickRatio = MathMin(MathMax(wickRatio, 0.0), 50.0);
   wickBodyAccum += wickRatio;

   double pos = (close - low) / range;
   if(pos >= 0.80) ++nearHigh;
   else if(pos <= 0.20) ++nearLow;

   if(body <= InpDojiBodyPct * range) ++doji;

   double tr = BarTR(r, i);
   double atr_i = atrs[i];
   if(atr_i > 0 && tr > InpSpikeATRMult * atr_i) ++spikes;

   bool big = (atr_i > 0 && tr > 1.0 * atr_i);
   if(big)
   {
      ++bigTotal;
      if(i > 0)
      {
         double trPrev = BarTR(r, i-1);
         double atrPrev = atrs[i-1];
         if(atrPrev > 0 && trPrev > 1.0 * atrPrev) ++bigThenBig;
      }
   }
}

// Aggregate into DNAMetrics fields (example assignments)
D.wick_body_ratio_avg = (N > 0 ? wickBodyAccum / N : 0.0);
D.pct_close_near_high = SafeDiv(nearHigh, N);
D.pct_close_near_low  = SafeDiv(nearLow, N);
D.pct_doji            = SafeDiv(doji, N);
D.pct_spikes          = SafeDiv(spikes, N);
D.vol_clustering      = (bigTotal > 0 ? SafeDiv(bigThenBig, bigTotal) : 0.0);
D.nearHigh_count = nearHigh; D.spikes_count = spikes; D.bigThenBig_count = bigThenBig;
Structural analysis: swings, retracements, and breakout follow-through
We detect fractal swing points with BuildSwings(r, InpFractalDepth, sw[]), which finds local highs and lows using the configured depth neighborhood. We then compute swing cycle statistics (average bars per impulse, swing_cycle_bars_avg, and fractal_density). For retracement behavior, we call ComputeRetracementHistogram(r, sw, swN, ...): for each opposite-direction impulse, we scan forward up to InpRetrWindowBars and record the maximum retracement ratio relative to the impulse; maxima are bucketed into 38%/50%/62%/>70% bands and averaged (avg_max_retr) to produce retr_38_freq, retr_50_freq, retr_62_freq, and retr_gt70_freq.
Separately, ComputeBreakoutFollowThrough scans swing events and checks whether a breakout beyond the swing extreme reaches an ATR-scaled target (InpFT_ATR_Mult * atr), producing breakout_follow_through as the fraction of followed-through events. Together these structural metrics quantify trend rhythm, typical pullback magnitudes, and breakout reliability.
// Fractal swing builder (returns newest-first series layout)
struct Swing { int index; double price; bool isHigh; };

int BuildSwings(MqlRates &r[], int depth, Swing &sw[])
{
   ArrayResize(sw, 0);
   int N = ArraySize(r);
   for(int i = depth; i < N - depth; ++i)
   {
      bool highP = true, lowP = true;
      double h = r[i].high, l = r[i].low;
      for(int k = 1; k <= depth; ++k)
      {
         if(r[i-k].high >= h || r[i+k].high >= h) highP = false;
         if(r[i-k].low <= l || r[i+k].low <= l) lowP = false;
         if(!highP && !lowP) break;
      }
      if(highP) { int n = ArraySize(sw); ArrayResize(sw, n+1); sw[n].index = i; sw[n].price = h; sw[n].isHigh = true; }
      if(lowP)  { int n = ArraySize(sw); ArrayResize(sw, n+1); sw[n].index = i; sw[n].price = l; sw[n].isHigh = false; }
   }
   // sort by index ascending (newest first in series layout)
   for(int a=0;a<ArraySize(sw);++a)
      for(int b=a+1;b<ArraySize(sw);++b)
         if(sw[a].index > sw[b].index) { Swing t = sw[a]; sw[a] = sw[b]; sw[b] = t; }
   return ArraySize(sw);
}

// Retracement histogram (core loop)
void ComputeRetracementHistogram(MqlRates &r[], Swing &sw[], int swN,
                                 double &f38, double &f50, double &f62, double &f70,
                                 double &avgRetr, int &counted_out)
{
   int counted=0, c38=0, c50=0, c62=0, c70=0;
   double sumMaxRetr = 0.0;

   for(int i=0; i < swN-1 && counted < InpRetrLookbackSwings; ++i)
   {
      Swing a = sw[i], b = sw[i+1];
      if(a.isHigh == b.isHigh) continue;

      Swing older = (a.index > b.index ? a : b);
      Swing newer = (a.index > b.index ? b : a);
      double impulse = MathAbs(older.price - newer.price);
      int start = newer.index - 1;
      int end   = MathMax(0, newer.index - InpRetrWindowBars);
      double maxRetr = 0.0;

      if(impulse > 0 && start >= 0 && start >= end)
      {
         if(older.isHigh && !newer.isHigh)
         {
            for(int k = start; k >= end; --k)
            {
               double retr = SafeDiv(r[k].high - newer.price, impulse);
               if(retr > maxRetr) maxRetr = retr;
            }
         }
         else if(!older.isHigh && newer.isHigh)
         {
            for(int k = start; k >= end; --k)
            {
               double retr = SafeDiv(newer.price - r[k].low, impulse);
               if(retr > maxRetr) maxRetr = retr;
            }
         }
      }

      counted++;
      if(impulse > 0)
      {
         sumMaxRetr += maxRetr;
         if(maxRetr < 0.44) ++c38;
         else if(maxRetr < 0.56) ++c50;
         else if(maxRetr < 0.70) ++c62;
         else ++c70;
      }
   }

   if(counted > 0)
   {
      f38 = double(c38) / counted;
      f50 = double(c50) / counted;
      f62 = double(c62) / counted;
      f70 = double(c70) / counted;
      avgRetr = sumMaxRetr / counted;
   }
   else { f38 = f50 = f62 = f70 = avgRetr = 0.0; }
   counted_out = counted;
}

// Breakout follow-through check
double ComputeBreakoutFollowThrough(MqlRates &r[], Swing &sw[], int swN, int atrPeriod, double ftAtrMult)
{
   if(swN < 2) return 0.0;
   int events = 0, success = 0;
   for(int i=0; i < swN-1 && events < 80; ++i)
   {
      int s_index = sw[i].index;
      double s_price = sw[i].price;
      bool s_isHigh = sw[i].isHigh;
      int start = s_index - 1;
      if(start < 0) continue;
      double atr = CalcATR(r, atrPeriod, s_index);
      double target = ftAtrMult * atr;
      if(target <= 0) continue;

      bool broke = false, followed = false;
      for(int k = start; k >= 0; --k)
      {
         if(s_isHigh)
         {
            if(r[k].high > s_price) { broke = true; if((r[k].high - s_price) >= target) { followed = true; break; } }
         }
         else
         {
            if(r[k].low < s_price) { broke = true; if((s_price - r[k].low) >= target) { followed = true; break; } }
         }
      }
      if(broke) { ++events; if(followed) ++success; }
   }
   return (events > 0 ? double(success) / events : 0.0);
}
Compare snapshots, mutation detection, and signal generation
Once we have a new DNAMetrics instance, we turn selected fields into a fixed 17-dimensional vector with DNAVector(D, vec[]). We compare the current and previous builds using CosineDistance(A,B) and NormalizedL2Distance(A,B). If either distance exceeds InpMutationThresh / InpMutationL2Thresh, we visually flag a mutation banner and (if enabled) issue an Alert(); the code also colors that banner based on severity.
Parallel to mutation detection, GenerateSignal(constDNAMetrics &D) composes buy and sell scores from breakout-follow-through, smoothness index, spike frequency, closeness-to-low/high, and retracement buckets; it applies an ATR-derived penalty, clamps scores, and only outputs BUY/SELL when the score meets InpSignalThreshold and exceeds the opposite score by InpSignalGap. MaybeNotify enforces a cooldown (15 minutes) for notifications; signals and their full diagnostic reason strings are appended to MarketDNA_signals.csv for offline review.
// Build vector for comparison (17-dim)
void DNAVector(DNAMetrics &D, double &vec[])
{
   int n = 17;
   ArrayResize(vec, n);
   vec[0]  = D.wick_body_ratio_avg;
   vec[1]  = D.pct_close_near_high;
   vec[2]  = D.pct_close_near_low;
   vec[3]  = D.pct_doji;
   vec[4]  = D.atr_norm;
   vec[5]  = D.pct_spikes;
   vec[6]  = D.vol_clustering;
   vec[7]  = D.swing_cycle_bars_avg;
   vec[8]  = D.fractal_density;
   vec[9]  = D.breakout_follow_through;
   vec[10] = D.retr_38_freq;
   vec[11] = D.retr_50_freq;
   vec[12] = D.retr_62_freq;
   vec[13] = D.asia_range_share;
   vec[14] = D.london_range_share;
   vec[15] = D.ny_range_share;
   vec[16] = D.smoothness_index;
}

// Cosine distance and normalized L2
double CosineDistance(DNAMetrics &A, DNAMetrics &B)
{
   double va[], vb[];
   DNAVector(A, va); DNAVector(B, vb);
   double dot=0, na=0, nb=0;
   for(int i=0;i<ArraySize(va);++i) { dot += va[i]*vb[i]; na += va[i]*va[i]; nb += vb[i]*vb[i]; }
   double denom = MathSqrt(na)*MathSqrt(nb);
   if(denom <= 0) return 1.0;
   double cos = dot / denom;
   return 1.0 - MathMax(-1.0, MathMin(1.0, cos));
}

double NormalizedL2Distance(DNAMetrics &A, DNAMetrics &B)
{
   double va[], vb[];
   DNAVector(A, va); DNAVector(B, vb);
   double num=0.0, denom=0.0;
   for(int i=0;i<ArraySize(va);++i) { double d = va[i] - vb[i]; num += d*d; denom += va[i]*va[i]; }
   double l2 = MathSqrt(num);
   double scale = MathSqrt(denom) + 1e-9;
   return l2 / scale;
}

// Signal generation (rule-based)
Signal GenerateSignal(const DNAMetrics &D)
{
   Signal s; s.type = SIGNAL_NONE; s.score = 0.0; s.reason = "";

   double cFT = Clamp(D.breakout_follow_through, 0.0, 1.0);
   double cSmooth = Clamp(D.smoothness_index, 0.0, 1.0);
   double cNotSpikes = 1.0 - Clamp(D.pct_spikes, 0.0, 1.0);
   double cRetr38 = Clamp(D.retr_38_freq, 0.0, 1.0);
   double cRetrGT70 = Clamp(D.retr_gt70_freq, 0.0, 1.0);

   // weights
   double wFT = 0.50, wSmooth = 0.25, wNotSpikes = 0.15, wRetr38 = 0.10;
   double wSellNearLow = 0.30, wSellSpikes = 0.25, wSellSmoothInv = 0.25, wSellRetrGT70 = 0.20;

   double buyScore = wFT*cFT + wSmooth*cSmooth + wNotSpikes*cNotSpikes + wRetr38*cRetr38;
   double sellScore = wSellNearLow*Clamp(D.pct_close_near_low,0,1) + wSellSpikes*Clamp(D.pct_spikes,0,1)
                      + wSellSmoothInv*(1.0 - cSmooth) + wSellRetrGT70*cRetrGT70;

   double atrPenalty = Clamp(D.atr_norm * 10.0, 0.0, 0.5);
   double buyScorePen = Clamp(buyScore * (1.0 - atrPenalty), 0.0, 1.0);
   double sellScorePen = Clamp(sellScore * (1.0 - atrPenalty * 0.5), 0.0, 1.0);

   double minThreshold = InpSignalThreshold;
   double minGap = InpSignalGap;

   s.reason = StringFormat("buy_raw=%.3f sell_raw=%.3f buy=%.3f sell=%.3f", buyScore, sellScore, buyScorePen, sellScorePen);

   if(buyScorePen - sellScorePen >= minGap && buyScorePen >= minThreshold) { s.type = SIGNAL_BUY; s.score = buyScorePen; }
   else if(sellScorePen - buyScorePen >= minGap && sellScorePen >= minThreshold) { s.type = SIGNAL_SELL; s.score = sellScorePen; }
   else { s.type = SIGNAL_NONE; s.score = MathMax(buyScorePen, sellScorePen); }
   return s;
}

// Notification cooldown
void MaybeNotify(const Signal &s, string sym)
{
   if(s.type == SIGNAL_NONE) return;
   if(TimeCurrent() - gLastSignalTime < 60*15) return; // 15-minute cooldown
   string text = StringFormat("MarketDNA %s %s signal score=%.2f reason=%s", sym, SignalTypeToString(s.type), s.score, s.reason);
   SendNotification(text); Alert(text);
   gLastSignalTime = TimeCurrent();
}
Display, persistence, and lifecycle controls
Finally, we render outputs via on-chart objects. DrawPassport(title, D, x, y) assembles a rectangular panel (ObjectCreate with OBJ_RECTANGLE_LABEL) and numerous labeled lines (OBJ_LABEL) showing each metric, warnings, and timestamps; DrawComparison draws a compact similarity header when a comparison symbol is present. We persist results using WriteCSV(D, sym) and WriteSignalCSV(s, sym) to files placed in FILE_COMMON (file headers are created when the file is new).
The EA lifecycle uses OnInit to set EventSetTimer(sec) (enforcing sec >= 5), OnTimer to call Recalculate(), and Recalculate() is optimized to skip heavy rebuilds when the newest closed bar time hasn't changed (CopyRates(..., 0, 1) check). OnDeinit kills the timer, and ClearObjects() removes prefixed UI objects. Optional InpSelfTest and InpDebugRetr modes let us validate the swing/retracement logic and print debug traces.
// Create or update label helper
void CreateOrSetLabel(string name, int corner, int x, int y, string text, int fontsize=11, color clr=(color)(-1))
{
   string obj = Pref()+name;
   color useclr = (clr == (color)(-1) ? TextColor() : clr);
   if(ObjectFind(0,obj) == -1)
   {
      ObjectCreate(0,obj,OBJ_LABEL,0,0,0);
      ObjectSetInteger(0,obj,OBJPROP_CORNER,corner);
      ObjectSetInteger(0,obj,OBJPROP_XDISTANCE,x);
      ObjectSetInteger(0,obj,OBJPROP_YDISTANCE,y);
      ObjectSetInteger(0,obj,OBJPROP_FONTSIZE,fontsize);
      ObjectSetInteger(0,obj,OBJPROP_COLOR,useclr);
      ObjectSetString(0,obj,OBJPROP_FONT,"Arial");
   }
   ObjectSetString(0,obj,OBJPROP_TEXT,text);
}

// Minimal DrawPassport example (truncated)
void DrawPassport(string title, DNAMetrics &D, int x, int y)
{
   CreateOrSetRect(title+"_bg", InpCorner, x, y, 360, 460, BgColor());
   CreateOrSetLabel(title+"_hdr", InpCorner, x+10, y+8, title, 12, Accent());
   CreateOrSetLabel(title+"_ATR", InpCorner, x+10, y+32, StringFormat("ATR: %.1f pips (%.3f%%)", D.atr_pips, D.atr_norm*100.0), 10, TextColor());
   CreateOrSetLabel(title+"_WB", InpCorner, x+10, y+50, StringFormat("Wick/Body avg: %.2f", D.wick_body_ratio_avg), 10, TextColor());
   // ... add more labels for other metrics
}

// CSV writing (append, creates header when empty)
void WriteCSV(DNAMetrics &D, string sym)
{
   if(!InpLogCSV) return;
   string fname = InpCSVFileName;
   int handle = FileOpen(fname, FILE_READ|FILE_WRITE|FILE_CSV|FILE_COMMON|FILE_ANSI);
   if(handle == INVALID_HANDLE) { PrintFormat("Unable to open CSV '%s'", fname); return; }
   if(FileSize(handle) == 0)
      FileWrite(handle, "timestamp","symbol","tf","sample_bars","wick_body_avg","pct_close_high","pct_close_low","pct_doji","atr_mean","atr_pips");
   FileSeek(handle, 0, SEEK_END);
   FileWrite(handle, TimeToString(TimeCurrent(), TIME_DATE|TIME_SECONDS), sym, TFToString(InpTF), D.sample_bars, D.wick_body_ratio_avg, D.pct_close_near_high, D.pct_close_near_low, D.pct_doji, D.atr_mean, D.atr_pips);
   FileClose(handle);
}

// Lifecycle hooks (skeleton)
int OnInit()
{
   EventSetTimer(MathMax(5, InpRecalcSeconds)); // enforce minimal cadence
   CreateOrSetLabel("status", InpCorner, InpX, InpY + 380, "Idle: waiting first calculation...", 10, TextColor());
   if(InpSelfTest) SelfTest();
   Recalculate(); // initial build
   return INIT_SUCCEEDED;
}

void OnTimer()
{
   Recalculate(); // optimized to rebuild only on new closed bar
}

void OnDeinit(const int reason)
{
   EventKillTimer();
   ClearObjects(); // cleanup
}
Outcomes
When we attached the EA to the EURUSD H1 chart, it immediately built the Market-DNA panel and computed the instrument’s metrics over the chosen sample. The panel summarizes volatility, spike and retracement profiles, session contributions, and other structural signals; based on those normalized metrics, the EA computed separate buy and sell scores and issued a BUY signal because the buy score exceeded the sell score by the configured gap and passed the threshold. The panel timestamp, score, and diagnostic line explain why the bias was bullish (high breakout follow-through, low spike frequency, moderate smoothness), so the visual diagram documents the decision process rather than just showing an isolated trade suggestion.
From the 1,200-bar sample, we found 171 swings and 80 retracements (about 44.2% of swings produced a measurable retracement). The London session accounts for the largest share of range, so if you want to trade sharp moves, focus on London hours. Swing cycles average 9.62 bars, which indicates how regularly swings occur. Most importantly, breakout follow-through is extremely high (≈98%).
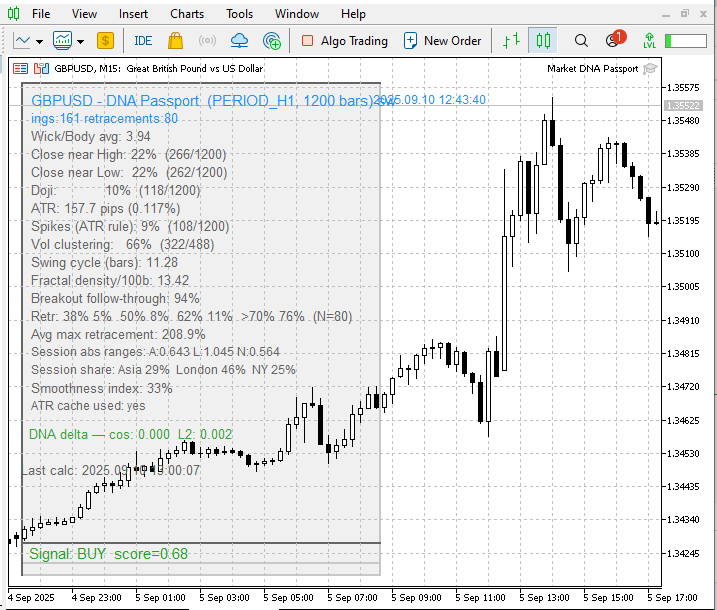
The corresponding diagram is for GBPUSD, a pair that correlates with EURUSD. The Market-DNA shows greater variation compared with EURUSD: it recorded 161 swings and 80 retracements, with an average swing cycle of 11.28 bars. Breakout follow-through is high (≈94%), and the London session supplies the largest share of range (≈46%).
Conclusion
Having taken you through the entire process—from the initial idea, through implementation, and finally to testing with encouraging results—we can now conclude that this tool effectively captures the unique “make-up” of each pair based on its price action. You can experiment with the inputs, backtest, or demo test to find values that best suit your strategy. Keep in mind, however, that this EA is designed primarily for educational purposes, particularly to reveal the identity of each pair through its historical price action. It should not be used for live trading with real money but rather as a supportive tool alongside your existing strategies.
See my other articles.
Warning: All rights to these materials are reserved by MetaQuotes Ltd. Copying or reprinting of these materials in whole or in part is prohibited.
This article was written by a user of the site and reflects their personal views. MetaQuotes Ltd is not responsible for the accuracy of the information presented, nor for any consequences resulting from the use of the solutions, strategies or recommendations described.

- Free trading apps
- Over 8,000 signals for copying
- Economic news for exploring financial markets
You agree to website policy and terms of use
Again nice brain firing idea & work from C.Benjamin, thx and have healthy days for u and beloved ones.