
Capital management in trading and the trader's home accounting program with a database

Introduction
Imagine a ship captain heading out to sea without navigational instruments. Madness? Absolutely. But this is exactly what most traders do when they try to conquer the financial markets without a system for tracking their trades and finances. According to statistics, more than 95% of traders lose money in the first year of trading. And do you know what the remaining successful 5% have in common? Iron discipline in accounting and capital management.
"I remember all my trades," "bookkeeping takes too much time," "the main thing is a good strategy, and the numbers can wait"... I hear these and similar phrases almost every day from novice traders. After a few months, these same traders are surprised to find that their account is inexorably melting away, and the reasons for this remain a mystery.
Now let's imagine a different picture. You sit down at your computer in the morning and the first thing you do is open not the trading terminal, but your accounting system. The whole picture is in the palm of your hand: your income, expenses, assets, transaction history, and profitability graphs. You know exactly how much you can afford to risk today, what percentage of your deposit your drawdown is, and how close you are to your financial goals.
It is not just convenient, it is vital. Because trading is not just about charts and indicators. This is, first and foremost, a business where you are simultaneously the CEO, the CFO, and the risk manager. And a successful business is impossible without clear accounting.
In this article, we will discuss a revolutionary approach to managing a trader's finances. I am not just going to introduce you to accounting software; I am going to show you a tool that might become your reliable financial navigator in the stormy sea of trading.
This system was born from the personal experience and pain of hundreds of traders who learned from their mistakes. It has incorporated the best practices of capital management and financial planning. But the main thing is that it is incredibly easy to use. Because I firmly believe that complex solutions often remain unused.
Ready to take the first step towards professional financial management? Then make yourself comfortable. We begin our journey into the world of financial literacy for traders, where every number matters and every decision is based on data, not emotion.
Basic principles of capital management for a trader
Every trader is familiar with that tempting thought: “What if I put all my money into this promising trade? Here it is - the opportunity to change my life at once!" And it is at moments like these that it is especially important to remember the fundamental principle that distinguishes professional traders from gamblers: sound capital management.
Let's start with the most important thing - the separation of trading and personal capital. Imagine a restaurant owner who takes money from the company funds to buy himself a new phone. Sounds absurd, isn't it? But this is exactly what many traders do, mixing a trading account with personal finances. Your trading capital is your business tool, not your wallet for everyday expenses. When you clearly distinguish between these two areas, an amazing thing happens: your trading decisions become more balanced, and your personal life becomes calmer and more predictable.
Let's talk about your emergency fund — your financial shield. Do you know why acrobats work with a safety net? Not because they do not believe in their skills, but because they understand that even the best can stumble. Your emergency fund is that safety net. This is not just money for a rainy day, it is your ticket to worry-free trading. When you know your family and basic needs are protected regardless of the trading outcome, you can focus entirely on the market without worrying about monthly payments and bills.
Also, the most important thing is to immediately send 10% of any income either to a separate bank account or to a brokerage account for purchasing stocks. In my experience, the second option is better because it will prevent you from being tempted to spend your money (selling shares and withdrawing funds will take some time).
Now let's move on to the most intriguing part - risk and position size management. Do you know why most traders lose money? Not because of bad strategies or lack of knowledge. They lose because they do not know how to control the size of their positions. It is like playing poker: even if you have a royal flush, you can go broke if you bet too much.
I like to compare risk management to the art of fencing. Every transaction is a duel with the market. But success depends not on the strength of the blow, but on the ability to defend. A professional trader never risks more than 1-2% of his capital in one trade. This is not cowardice - this is wisdom. Even a series of ten losing trades in a row (and this happens to everyone) will not significantly damage your account.
Position sizing is your primary weapon in risk management. Imagine adjusting the volume of music: too quiet and you will not hear the melody, too loud and you risk damaging the speakers. Likewise, with position size, it should be large enough to generate meaningful profits, but not so large that one wrong market move can wipe out your account.
And remember: the market will always exist, but your capital may run out. Every time you open the terminal, ask yourself: "Will I be able to sleep peacefully with this position? "Or will I have to wake up in the middle of the night checking the quotes?" If you are doubtful, reduce the position size. It is better to have a small profit than a lot of stress.
MetaTrader 5 report key metrics: How to read a success story
Think of the MetaTrader 5 report as a detailed medical examination of your trading system. Each metric tells an important part of the story about the health of your trading. Let's break down what each metric means and why it is important.
Key profitability parameters
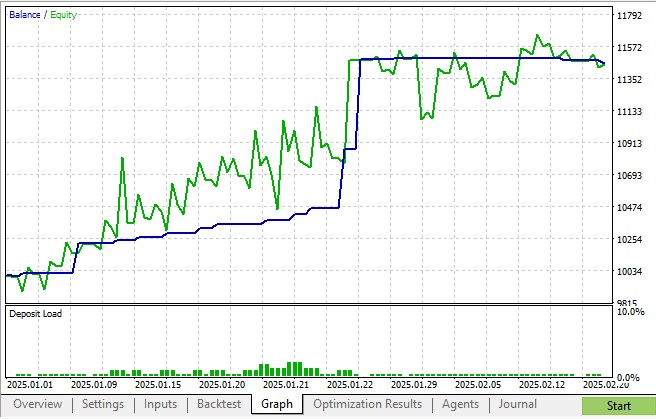
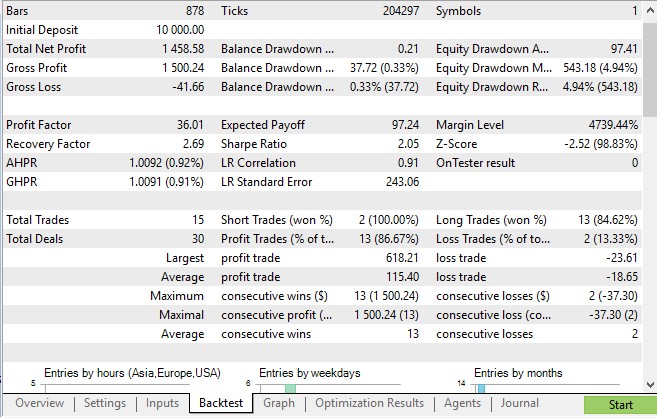
Net profit is the final result of your entire trade, taking into account all wins and losses. It is like the final score in a football match. In the MetaTrader 5 report, you will find it as the first line in the results section. For example, in our collective trading system on 3D bars based on price, time and volume, the net profit was an impressive USD 1458.
Gross Profit and Gross Loss are the sums of all your winning and losing trades separately. They show the complete picture of your successes and failures. In our case, we have the profit of USD 1500 against the losses of USD 41. This ratio indicates a healthy balance in the system.
Drawdown indicators
MetaTrader 5 tracks several types of drawdown:
- Balance Drawdown Absolute shows the maximum decrease from the starting value of the balance or funds. It is like measuring the depth of a hole in your path. In our example, the absolute drawdown in funds was only USD 97 - a very conservative figure.
- Balance Drawdown Maximal is the largest percentage decrease. In trading on 3D bars, it amounted to 4.97% of funds - this is within the normal range for a trading system.
- Balance Drawdown Relative shows local maximums of decline.
Statistics
- Profit Factor — ratio of total profit to total loss. A value above 1.5 is considered excellent, and our system showed 36.
- Sharpe Ratio measures the ratio of return to risk. The value of 2 in our report indicates high system efficiency.
- Expected Payoff shows how much profit, on average, can be expected from each trade. In our case, it is USD 97, which is very good.
Operational metrics
- Total Trades — total number of market entries. We have 15 trades - a very small sample for statistical significance of the results.
- Profit Trades (% of total) one of the most important indicators. In our system, it is a staggering 86%! This is an exceptionally high result.
- Average profit/loss trade - the average profit and loss per trade. In our case, it is USD 115 versus USD 18. Despite the larger average loss, the high percentage of profitable trades makes the system highly profitable.
Sequences
Maximum consecutive wins/losses show the best and worst streaks. Our system showed a phenomenal series of 13 profitable trades in a row with a profit of USD 1,500!
How to use these metrics
When analyzing a MetaTrader 5 report, pay special attention to:
- Profit Factor
- Profit Trades (% of total)
- Balance Drawdown Maximal
- Average profit/loss trade
All these indicators taken together create a complete picture of the efficiency of your trading system. In the case of our 3D bar system, we see an exceptionally stable and profitable strategy with an excellent risk-reward ratio.
Keep in mind that in MetaTrader 5, each metric has its own meaning, but only a comprehensive analysis allows you to make informed decisions about the efficiency of your trading system.
When numbers conquer fear
Imagine a pilot flying through storm clouds. What helps him stay calm? Aircraft equipment. When the weather is raging outside, the equipment readings become the only connection with reality. In trading, your trading indicators are like the cockpit equipment.
Data instead of emotions
Phrases like "I think" or "I have a feeling" lead to losses. The market moves according to its own laws, and the only way to stay on track is to follow the data. If, for example, 321 out of 367 trades turned out to be profitable, this is not a guess, but a fact.
Greed is the enemy of a trader
Greed comes in moments of success, pushing you to increase the volume. But the trading journal reminds that the maximum drawdown is 5%. This is not just a number, but a warning that overconfidence is punished.
Fear paralyzes
The previous loss prevents you from pressing the Buy button, even when the signals say "yes". But the statistics should reassure you.
Balance of risk and caution
Just as a tightrope walker maintains balance, so too must a trader do the same. If the average winning trade is USD 115 and the average loss is USD 18, the system works not because there are no losses, but because of risk management.
Path to emotional freedom
Successful trading is not about suppressing emotions, but about controlling them. Fear helps us manage risk, greed reminds us to take profits, but decisions should be based on data, not feelings. The market is indifferent, and only statistics help us weather any storm.
Trader home accounting in Python
Successful trading is impossible without clear financial accounting. Every transaction, every movement of capital must be under constant control. In this article, I present to you a professional solution for accounting of trader's finances, developed in Python using modern libraries for data analysis and visualization.
The program allows you to keep detailed records of all financial deals, manage assets and liabilities, generate analytical reports, and visualize financial flows. Let's take a closer look at its structure and functionality.
Program architecture
The program is based on an object-oriented approach. The main HomeAccounting class encapsulates all the logic for working with financial data. SQLite is used to store information — a lightweight yet powerful database that does not require a separate server.
Let's look at the basic structure of the program:
class HomeAccounting:
    def __init__(self, root):
        self.root = root
        self.root.title("Home accounting")
        self.root.geometry("1200x700")

        # Create a database
        self.create_database()

        # Create main tabs
        self.notebook = ttk.Notebook(root)
        self.notebook.pack(expand=True, fill='both', padx=10, pady=5)

        # Tabs
        self.transactions_tab = ttk.Frame(self.notebook)
        self.assets_tab = ttk.Frame(self.notebook)
        self.reports_tab = ttk.Frame(self.notebook)
This code creates the basic framework of the application with three key sections: transactions, assets/liabilities, and reports. The interface is built on tkinter, the standard Python library for creating graphical applications.
Data storage system
Particular attention is paid to arranging the database. Two main tables — transactions and assets — store all the necessary information:
def create_database(self):
    conn = sqlite3.connect('home_accounting.db')
    c = conn.cursor()

    # Create a transaction table
    c.execute('''CREATE TABLE IF NOT EXISTS transactions
                (id INTEGER PRIMARY KEY,
                 date TEXT,
                 type TEXT,
                 category TEXT,
                 amount REAL,
                 description TEXT)''')

    # Create an asset/liability table
    c.execute('''CREATE TABLE IF NOT EXISTS assets
                (id INTEGER PRIMARY KEY,
                 name TEXT,
                 type TEXT,
                 value REAL,
                 date TEXT)''')
This structure allows for efficient storage and quick retrieval of necessary information. Each transaction receives a unique ID, and all fields are indexed for quick searching.
Transaction management
The transaction module is the heart of the system. Here, every financial transaction goes through three stages: input, validation, and saving:
def add_transaction(self):
    try:
        date = self.date_entry.get_date().strftime("%Y-%m-%d")
        type_ = self.type_combo.get()
        category = self.category_entry.get()
        amount = float(self.amount_entry.get())
        description = self.description_entry.get()

        conn = sqlite3.connect('home_accounting.db')
        c = conn.cursor()
        c.execute('''INSERT INTO transactions
                    (date, type, category, amount, description)
                    VALUES (?, ?, ?, ?, ?)''',
                 (date, type_, category, amount, description))
        conn.commit()
        conn.close()
Particular attention is paid to error handling and data validation. Each value is checked before saving, which eliminates the possibility of entering incorrect information.
Analytical system
The most powerful part of the program is the analytics module. Here, pandas and matplotlib combine to create a comprehensive financial analysis:
def generate_report(self):
    start = self.start_date.get_date()
    end = self.end_date.get_date()

    conn = sqlite3.connect('home_accounting.db')

    # Get transaction data
    transactions_df = pd.read_sql_query(f'''
        SELECT type, SUM(amount) as total
        FROM transactions
        WHERE date BETWEEN '{start_str}' AND '{end_str}'
        GROUP BY type
    ''', conn)
The system generates detailed reports, including:
- Funds flow analysis
- Calculating net asset value
- Balance dynamics
- Structural analysis of income and expenses
Data visualization
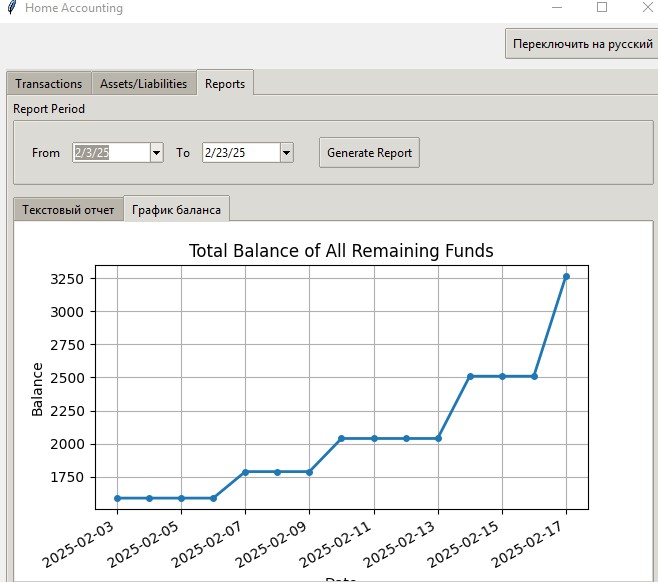
Particular attention is paid to visualization. The balance change graph is created using matplotlib:
def plot_balance_chart(self, transactions_df):
    if transactions_df.empty:
        return

    transactions_df['date'] = pd.to_datetime(transactions_df['date'])
    date_range = pd.date_range(transactions_df['date'].min(),
                             transactions_df['date'].max(),
                             freq='D')

    transactions_df['amount'] = transactions_df.apply(
        lambda x: x['amount'] if x['type'] == 'Income' else -x['amount'],
        axis=1)
The chart automatically scales, supports interactivity, and updates in real time as new data is added.
Where does the program get the data from?
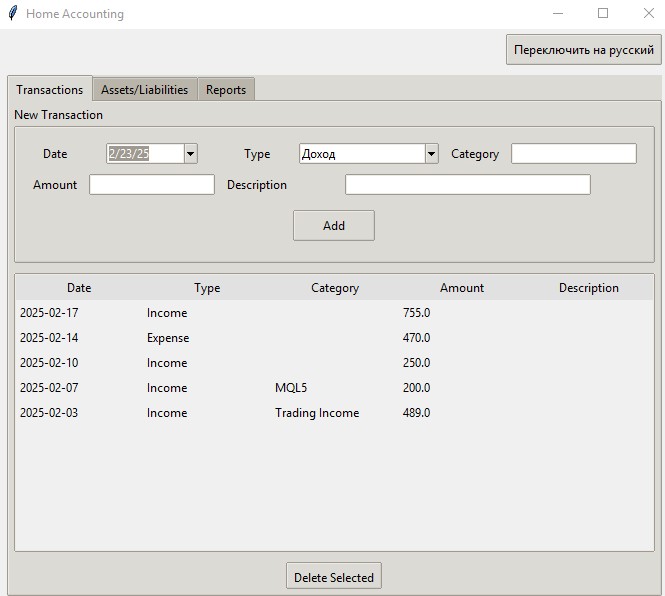
Manual input in the interface
The program is designed with maximum convenience for the trader. The main way to fill the database is to manually enter information through the intuitive tkinter interface.
Filling out fields in the application occurs through a specially designed form with intuitive controls. The user can select a date using the built-in calendar, use drop-down lists to select the transaction type, and specify transaction details in the appropriate fields.
Data entry is extremely versatile: the program allows you to record a variety of financial transactions, from income received through trading to personal expenses and investment income. Each transaction can be described in detail, ensuring transparency of financial accounting.
The tkinter interface is designed to be simple and easy to use. The minimalist design allows for quick data entry, and instant saving to a SQLite database ensures that no financial transactions are lost. The program supports two languages — Russian and English — making it accessible to a wide range of users.
This approach transforms the routine process of financial accounting into a simple and enjoyable procedure, helping traders maintain a complete picture of their income and expenses.
Practical use
On real data, the program shows impressive efficiency. Let's look at an example of using it to analyze trading results for a quarter:
- We download the transaction history and withdrawals from the broker — withdrawn (recorded) funds are our income.
- Fixed losses are our expenses
- Add information about other income and expenses
- Add information about interest income, or investment income (dividends)
- Add your assets and liabilities
- Generate a quarterly report
- Analyze yield charts
- We do not include information on closed transactions here analyzing only the broker's net deposits/withdrawals instead!
The program instantly processes data and provides a complete picture of the financial situation. It does not just show you dry numbers — it tells the story of your finances, helping you see their strengths and weaknesses.
And most importantly, the analysis is based solely on real cash flows, without confounding factors like temporary asset revaluations. As a result, you get a clear picture of your financial flows, convenient charts, and the ability to assess income stability, identify weaknesses in capital management, and, if necessary, adjust your strategy.
This tool will allow you to not only monitor your current capital status but also prepare reports for the tax authorities or to attract investors. The user-friendly interface makes working with the program comfortable and straightforward.
The program instantly processes data and provides a complete picture of the financial situation.
All transactions are saved to your database (created automatically).
The system is easily expandable. You can add:
- Integration with trading terminals
- Auto import of bank statements
- Machine learning-based forecasting
- Analyzing your financial behavior patterns using retailer association rules
- Additional visualization types
Conclusion
The presented application is a professional tool for managing trader's finances. It combines the power of Python for data analysis with the convenience of a modern interface. All code is available on GitHub, ready to use and modify to suit your needs.
In the following articles, we will look at the system advanced capabilities and add integration with the MetaTrader 5 trading platform.
Translated from Russian by MetaQuotes Ltd.
Original article: https://www.mql5.com/ru/articles/17282
Warning: All rights to these materials are reserved by MetaQuotes Ltd. Copying or reprinting of these materials in whole or in part is prohibited.
This article was written by a user of the site and reflects their personal views. MetaQuotes Ltd is not responsible for the accuracy of the information presented, nor for any consequences resulting from the use of the solutions, strategies or recommendations described.

- Free trading apps
- Over 8,000 signals for copying
- Economic news for exploring financial markets
You agree to website policy and terms of use
" The graph automatically scales, supports interactivity, and is updated in real time when new data is added."
What is the interactivity of the graph?