
From Basic to Intermediate: Objects (III)

Introduction
In the previous article, From Basic to Intermediate: Mouse Events we looked at how to handle mouse-related events, as well as mouse-and-keyboard combinations in a simple, clear, and reasonably objective way. This is necessary for creating combinations of pressed buttons and combinations of button presses to perform certain actions on the chart.
Although at first glance the functionality discussed in the previous article may seem relatively simple, when we move on to practice we notice that it can be much more complicated than it appears. This happens because, depending on the type of functionality we are going to implement and on the way it is implemented, some users may not have the required equipment. And although this is relatively common nowadays, many people do not use desktop computers.
Even among those who do use them, as is well known, some users may not have a mouse with more than three buttons. This makes it harder to implement some types of functions intended for a broad user base. There are no problems for personal use, but if you intend to learn programming in order to sell your applications, you will notice that not everyone has the necessary equipment. Thus, you can either act according to the needs of this audience, or ignore it and risk losing part of the market. And all of this because of a simple decision.
All right, but we are not here to learn how to sell the applications we create, but to bring our ideas to life using MQL5. Since the previous article was more focused on technical matters and a simple demonstration, it is time to put into practice what was shown there and thus create an alternative to the MetaTrader 5 crosshair tool.
Although the goal is not to create a replacement for it, but to show you that you can build useful things even with very limited knowledge, provided you understand the right concepts.
Custom indicator
What we want to show here has already been the subject of another article of ours Developing a Replay System (Part 30): Expert Advisor Project — C_Mouse Class (IV) . There we showed how to implement a mouse indicator using object-oriented programming (OOP). But here we will see something similar, although with a much simpler program aimed at beginners. Like you, dear reader.
Why repeat what has already been shown earlier? In fact, we will not repeat anything; it is only a concept. But since up to this point I have not talked about OOP at all, and only the structured approach has been shown, we want to show that we do not need to be specialists in order to create something suitable for our needs. We can do this with minimal knowledge, while always trying to apply the concepts already studied. And yet, in the end, we will get the desired result. In other words, simplicity works even when it seems insufficient.
To begin with, we will implement code based on one of those we examined in the previous article. It can be seen below:
01. //+------------------------------------------------------------------+
02. #property copyright "Daniel Jose"
03. //+------------------------------------------------------------------+
04. #define def_Prefix  "Demo"
05. //+------------------------------------------------------------------+
06. int OnInit()
07. {
08.     IndicatorSetString(INDICATOR_SHORTNAME, def_Prefix);
09.     ChartSetInteger(0, CHART_EVENT_MOUSE_MOVE, true);
10. //+----------------+
11.     ChartSetInteger(0, CHART_MOUSE_SCROLL, false);
12.     ChartSetInteger(0, CHART_CONTEXT_MENU, false);
13.     ChartSetInteger(0, CHART_CROSSHAIR_TOOL, false);
14. //+----------------+
15.     ChartSetInteger(0, CHART_KEYBOARD_CONTROL, false);
16.     ChartSetInteger(0, CHART_QUICK_NAVIGATION, false);
17. //+----------------+
18.
19.     return INIT_SUCCEEDED;
20. };
21. //+------------------------------------------------------------------+
22. int OnCalculate(const int rates_total, const int prev_calculated, const int begin, const double &price[])
23. {
24.     return rates_total;
25. };
26. //+------------------------------------------------------------------+
27. void OnChartEvent(const int id, const long &lparam, const double &dparam, const string &sparam)
28. {
29.     string sz = "";
30.
31.     switch (id)
32.     {
33.         case CHARTEVENT_KEYDOWN:
34.             break;
35.         case CHARTEVENT_MOUSE_MOVE:
36.             Comment(sz);
37.             sz += "Mouse position X: " + (string)(short)lparam;
38.             sz += "\nMouse position Y: " + (string)(short)dparam;
39.             Comment(sz);
40.             if ((uchar)sparam != 0) PrintFormat("Hexadecimal mask of mouse buttons is: 0x%02X", (uchar)sparam);
41.             break;
42.         case CHARTEVENT_MOUSE_WHEEL:
43.             break;
44.     }
45. };
46. //+------------------------------------------------------------------+
47. void OnDeinit(const int reason)
48. {
49.     Comment("");
50.     ChartSetInteger(0, CHART_EVENT_MOUSE_MOVE, false);
51. //+----------------+
52.     ChartSetInteger(0, CHART_MOUSE_SCROLL, true);
53.     ChartSetInteger(0, CHART_CONTEXT_MENU, true);
54.     ChartSetInteger(0, CHART_CROSSHAIR_TOOL, true);
55. //+----------------+
56.     ChartSetInteger(0, CHART_KEYBOARD_CONTROL, true);
57.     ChartSetInteger(0, CHART_QUICK_NAVIGATION, true);
58. //+----------------+
59. };
60. //+------------------------------------------------------------------+
Code 01
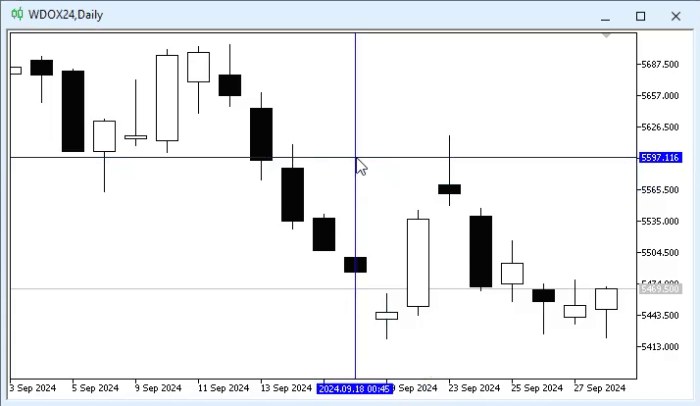
Code 01 is a modification of the code discussed in the previous article. This will allow us to test more easily. Please note that in line 40 we will output something to the terminal. This is exactly the value we need to use. Thus, when running code 01, we will see something similar to the following image.
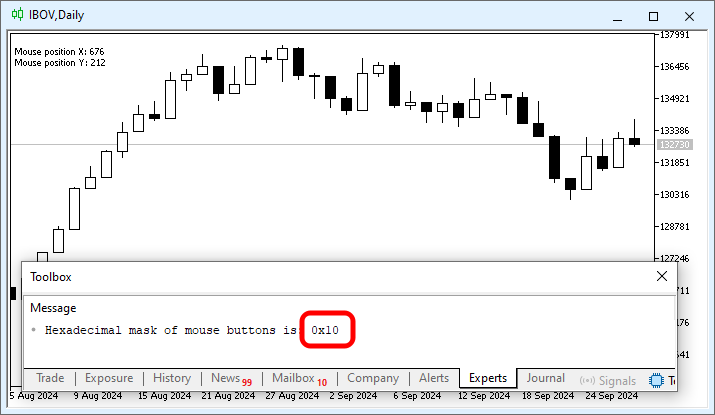
Image 01
The information highlighted in image 01 is exactly the mask that we need to use. This is necessary so that we can create an event that will display the custom crosshair for analysis. Pay attention to this. The value we see in image 01 is the value registered when the middle button is pressed. Thus, since pressing the middle button should create the custom crosshair for analysis, we can start thinking about how to do this. There is one more thing that needs to be understood.
If you practiced with the code shown in the previous article, you should have noticed that each of the calls made in the OnInit function located on line 06 of code 01, turns a standard MetaTrader 5 property on or off. However, since we only need to create a custom crosshair for analysis, we do not need to disable all of these events, because doing so would restrict the use of MetaTrader 5 too much for some users. It is best to disable only the event that we do not want MetaTrader 5 to use by default. In this case, it will be the event on line 13 of code 01.
So, we have the first item that we really need to change in code 01. But we can start working on the crosshair before moving on to the next code that we will implement. Pay close attention to what we are going to discuss; it is very important.
In the article From Basic to Intermediate: Objects (II) we showed how it is possible to work with two objects on the chart at the same time: a vertical line and a horizontal line.
So, both of the objects mentioned DO NOT USE SCREEN COORDINATES, since X and Y coordinates are known in relation to computer graphics. Both objects, OBJ_VLINE and OBJ_HLINE, use time-and-price coordinates. These chart coordinates are based on price and time. And since the operating system provides us with X and Y coordinates, we need to convert these screen coordinates into time-and-price coordinates. Performing this task manually is quite tedious, since it is necessary to take into account the minimum and maximum price, as well as the minimum and maximum time, in order to establish the relationship between price and time and the X and Y values provided by the operating system.
Fortunately, this task is performed using a procedure from the MQL5 standard library, which greatly simplifies the process. So, before we start looking at the crosshair drawn on the chart, let us see how to convert X and Y values into chart coordinates based on time and price.
01. //+------------------------------------------------------------------+
02. #property copyright "Daniel Jose"
03. //+------------------------------------------------------------------+
04. #define def_Prefix  "Demo"
05. //+------------------------------------------------------------------+
06. int OnInit()
07. {
08.     IndicatorSetString(INDICATOR_SHORTNAME, def_Prefix);
09.     ChartSetInteger(0, CHART_EVENT_MOUSE_MOVE, true);
10.     ChartSetInteger(0, CHART_CROSSHAIR_TOOL, false);
11.
12.     return INIT_SUCCEEDED;
13. };
14. //+------------------------------------------------------------------+
15. int OnCalculate(const int rates_total, const int prev_calculated, const int begin, const double &price[])
16. {
17.     return rates_total;
18. };
19. //+------------------------------------------------------------------+
20. void OnChartEvent(const int id, const long &lparam, const double &dparam, const string &sparam)
21. {
22.     string      sz = "";
23.     short       x, y;
24.     int         sub;
25.     datetime    dt;
26.     double      price;
27.
28.     switch (id)
29.     {
30.         case CHARTEVENT_KEYDOWN:
31.             break;
32.         case CHARTEVENT_MOUSE_MOVE:
33.             x = (short)lparam;
34.             y = (short)dparam;
35.             ChartXYToTimePrice(0, x, y, sub, dt, price);
36.             Comment(sz);
37.             sz += "Mouse position X: " + (string)x;
38.             sz += "\nMouse position Y: " + (string)y;
39.             sz += "\nMouse position time: " + TimeToString(dt, TIME_DATE | TIME_MINUTES);
40.             sz += "\nMouse position price: " + (string)price;
41.             Comment(sz);
42.             if ((uchar)sparam != 0) PrintFormat("Hexadecimal mask of mouse buttons is: 0x%02X", (uchar)sparam);
43.             break;
44.         case CHARTEVENT_MOUSE_WHEEL:
45.             break;
46.     }
47. };
48. //+------------------------------------------------------------------+
49. void OnDeinit(const int reason)
50. {
51.     Comment("");
52.     ChartSetInteger(0, CHART_EVENT_MOUSE_MOVE, false);
53.     ChartSetInteger(0, CHART_CROSSHAIR_TOOL, true);
54. };
55. //+------------------------------------------------------------------+
Code 02
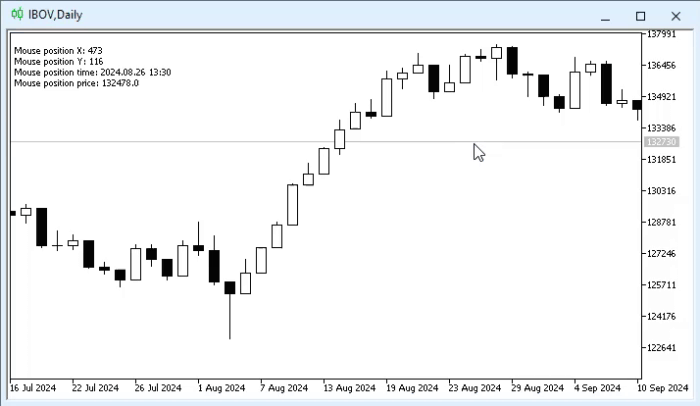
Here is a simpler code intended to enable or disable only the functions that are truly necessary. Everything else will remain the standard MetaTrader 5 behavior. Please note that we made small changes to the part corresponding to the mouse event handler. And in line 35 we see exactly the library procedure used to convert the values into the ones we actually need or want to use. It is important to understand this before directly using these values to control the OBJ_VLINE and OBJ_HLINE objects. To demonstrate these points, look at the following animation.
Animation 01
In animation 01, you can see that the chart is shown on the daily timeframe. However, if we look at the time values shown in the animation itself, we will see that we are dealing with data that can be considered intraday. And this may end up confusing many people, because if we are looking at a daily chart, how can we see intraday values?
In fact, these values are displayed precisely because the ChartXYToTimePrice procedure DOES NOT CONVERT values into the format we expect, but converts screen coordinates into time-and-price coordinates. And since small fluctuations along the axis lead to fractional values, these values eventually become values that are present during the day. That is why we see values that at first glance seem meaningless. Therefore, this is not an error, but only a small detail related to the transition from one type of coordinates to another.
In any case, based on what we have examined here, and with a little imagination and common sense, you will soon understand that we already have everything necessary to think about how to control OBJ_HLINE and OBJ_VLINE objects. This differs from what was shown in the article From Basic to Intermediate: Objects (II), where control was performed using the keyboard. But now we will use the mouse for this.
All right, and how will we do this? This is where the most interesting part begins, dear reader. To do this, we will first create a crosshair that will constantly remain on the chart. This is done using the code shown below.
01. //+------------------------------------------------------------------+
02. #property copyright "Daniel Jose"
03. //+------------------------------------------------------------------+
04. #define def_Prefix  "Demo"
05. //+------------------------------------------------------------------+
06. #define macro_NameObject  def_Prefix + (string)ObjectsTotal(0)
07. //+------------------------------------------------------------------+
08. string  gl_Objs[2];
09. //+------------------------------------------------------------------+
10. int OnInit()
11. {
12.     IndicatorSetString(INDICATOR_SHORTNAME, def_Prefix);
13.     ObjectCreate(0, gl_Objs[0] = macro_NameObject, OBJ_VLINE, 0, 0, 0);
14.     ObjectCreate(0, gl_Objs[1] = macro_NameObject, OBJ_HLINE, 0, 0, 0);
15.     ObjectSetString(0, gl_Objs[0], OBJPROP_TOOLTIP, "\n");
16.     ObjectSetString(0, gl_Objs[1], OBJPROP_TOOLTIP, "\n");
17.     ObjectSetInteger(0, gl_Objs[0], OBJPROP_COLOR, clrBlue);
18.     ObjectSetInteger(0, gl_Objs[1], OBJPROP_COLOR, clrBlue);
19.
20.     ChartSetInteger(0, CHART_EVENT_MOUSE_MOVE, true);
21.     ChartSetInteger(0, CHART_CROSSHAIR_TOOL, false);
22.
23.     return INIT_SUCCEEDED;
24. };
25. //+------------------------------------------------------------------+
26. int OnCalculate(const int rates_total, const int prev_calculated, const int begin, const double &price[])
27. {
28.     return rates_total;
29. };
30. //+------------------------------------------------------------------+
31. void OnChartEvent(const int id, const long &lparam, const double &dparam, const string &sparam)
32. {
33.     int         sub;
34.     datetime    dt;
35.     double      price;
36.
37.     switch (id)
38.     {
39.         case CHARTEVENT_KEYDOWN:
40.             break;
41.         case CHARTEVENT_MOUSE_MOVE:
42.             ChartXYToTimePrice(0, (short)lparam, (short)dparam, sub, dt, price);
43.             ObjectMove(0, gl_Objs[0], 0, dt, price);
44.             ObjectMove(0, gl_Objs[1], 0, dt, price);
45.             if ((uchar)sparam != 0) PrintFormat("Hexadecimal mask of mouse buttons is: 0x%02X", (uchar)sparam);
46.             break;
47.         case CHARTEVENT_MOUSE_WHEEL:
48.             break;
49.     }
50.     ChartRedraw();
51. };
52. //+------------------------------------------------------------------+
53. void OnDeinit(const int reason)
54. {
55.     ChartSetInteger(0, CHART_EVENT_MOUSE_MOVE, false);
56.     ChartSetInteger(0, CHART_CROSSHAIR_TOOL, true);
57.
58.     ObjectsDeleteAll(0, def_Prefix);
59.     ChartRedraw();
60. };
61. //+------------------------------------------------------------------+
Code 03
Applying code 03 to the chart will produce a result similar to this:
Animation 02
Please note that at the beginning of animation 02 the time value changes, although the vertical line remains unchanged. This happens because of small mouse movements, which is completely normal and acceptable. Notice that as the mouse pointer moves, the vertical and horizontal lines follow the mouse movement, allowing us to constantly display the crosshair on the chart.
Since what is being done here was already partially covered in the article From Basic to Intermediate: Objects (II), we will focus only on what is new here. In this case, the movement is now linked specifically to the values returned by the library procedure when converting screen coordinates into time-and-price coordinates.
But this was not exactly what we wanted. We wanted to display the same crosshair, but only after pressing the middle button. Therefore, to do this we need to make some changes to the code. But first, let us understand why lines 15, 16, and 58 are needed. All right, lines 15 and 16 prevent MetaTrader 5 from displaying a small message when we are over an object. If you want to display a message that explains the object itself, but do not want it to remain constantly on the chart, use the technique from lines 15 and 16 to place a meaningful message there. This message will be displayed when the mouse cursor remains still for a short time over the object it is pointing to.
Meanwhile, line 58 will delete all objects present on the chart whose prefix matches the specified one. Since we associate the objects with the indicator's own short name, it becomes easier to delete objects related to the indicator itself. If you want an object to remain on the chart, simply use a different prefix for the indicator name. Now we can look at the next code.
001. //+------------------------------------------------------------------+
002. #property copyright "Daniel Jose"
003. //+------------------------------------------------------------------+
004. #define def_Prefix  "Demo"
005. //+------------------------------------------------------------------+
006. #define macro_NameObject  def_Prefix + (string)ObjectsTotal(0)
007. //+------------------------------------------------------------------+
008. enum eBtnMouse  {
009.         MOUSE_LEFT      = 0x01,
010.         MOUSE_RIGHT     = 0x02,
011.         MOUSE_KEY_SHIFT = 0x04,
012.         MOUSE_KEY_CTRL  = 0x08,
013.         MOUSE_MIDDLE    = 0x10,
014.         MOUSE_EXTRA_1   = 0x20,
015.         MOUSE_EXTRA_2   = 0x40
016.                 };
017. //+------------------------------------------------------------------+
018. struct st_Cross
019. {
020.     private :
021. //+----------------+
022.         bool    IsView;
023.         string  Objs[2];
024. //+----------------+
025.         void Create(char index, ENUM_OBJECT type)
026.         {
027.             ObjectCreate(0, Objs[index] = macro_NameObject, type, 0, 0, 0);
028.             ObjectSetString(0, Objs[index], OBJPROP_TOOLTIP, "\n");
029.             ObjectSetInteger(0, Objs[index], OBJPROP_COLOR, clrBlue);
030.         }
031. //+----------------+
032.     public  :
033. //+----------------+
034.         void Show(void)
035.         {
036.             if (IsView) return;
037.             Create(0, OBJ_VLINE);
038.             Create(1, OBJ_HLINE);
039.             IsView = true;
040.             ChartRedraw();
041.         }
042. //+----------------+
043.         void Hide(void)
044.         {
045.             if (!IsView) return;
046.             for(uint c = 0; c < Objs.Size(); c++)
047.                 ObjectDelete(0, Objs[c]);
048.             ChartRedraw();
049.             IsView = false;
050.         }
051. //+----------------+
052.         void Move(short x, short y)
053.         {
054.             int         sub;
055.             datetime    dt;
056.             double      price;
057.
058.             if (!IsView) return;
059.             ChartXYToTimePrice(0, x, y, sub, dt, price);
060.             ObjectMove(0, Objs[0], 0, dt, price);
061.             ObjectMove(0, Objs[1], 0, dt, price);
062.             ChartRedraw();
063.         }
064. //+----------------+
065. }gl_Cross;
066. //+------------------------------------------------------------------+
067. int OnInit()
068. {
069.     gl_Cross.Hide();
070.
071.     IndicatorSetString(INDICATOR_SHORTNAME, def_Prefix);
072.     ChartSetInteger(0, CHART_EVENT_MOUSE_MOVE, true);
073.     ChartSetInteger(0, CHART_CROSSHAIR_TOOL, false);
074.
075.     return INIT_SUCCEEDED;
076. };
077. //+------------------------------------------------------------------+
078. int OnCalculate(const int rates_total, const int prev_calculated, const int begin, const double &price[])
079. {
080.     return rates_total;
081. };
082. //+------------------------------------------------------------------+
083. void OnChartEvent(const int id, const long &lparam, const double &dparam, const string &sparam)
084. {
085.
086.     switch (id)
087.     {
088.         case CHARTEVENT_KEYDOWN:
089.             break;
090.         case CHARTEVENT_MOUSE_MOVE:
091.             if (((uchar)sparam & MOUSE_MIDDLE) != 0) gl_Cross.Show();
092.             gl_Cross.Move((ushort)lparam, (ushort)dparam);
093.             break;
094.         case CHARTEVENT_MOUSE_WHEEL:
095.             break;
096.     }
097.     ChartRedraw();
098. };
099. //+------------------------------------------------------------------+
100. void OnDeinit(const int reason)
101. {
102.     ChartSetInteger(0, CHART_EVENT_MOUSE_MOVE, false);
103.     ChartSetInteger(0, CHART_CROSSHAIR_TOOL, true);
104.
105.     gl_Cross.Hide();
106. };
107. //+------------------------------------------------------------------+
Code 04
All right, but what does this code 04 do? In the end, what will happen is what we see in the following animation.
Animation 03
"Interesting. But I see that you switched to using structured code. Why?" Well, dear reader, the reason is precisely that structured code is easier to create and maintain for the crosshair itself. Remember that the purpose of a structure is precisely to create a whole set of functions and procedures that are directly related to a specific goal.
In the article From Basic to Intermediate: Struct (VII), where we explained how to structure code, everything was presented in an abstract form. But if we look at this from a less abstract point of view, everything begins to make sense.
In this case, in code 04, we are on the boundary between structured code and object-oriented code. This is because in code 04 it is clear that some points must be initialized before we can use the structure itself. And this is one of the reasons why OOP was created. Pay attention to the following: when the st_Cross structure is declared on line 65 to use the gl_Cross variable, we have no certainty about the values contained in IsView and in the Objs array. This makes it difficult to create certain types of code, especially code intended to work with specific kinds of data.
But since everything is relatively calm here, we can use line 69 to prepare the structure and start working with it. This is not the best way, but as already mentioned, here we are dealing with something relatively simple. Thus, when checking in line 91 whether the middle button has been pressed or not, we can choose whether or not to display the objects that create the simple crosshair for analysis. This is done by calling the Show procedure of the st_Cross structure.
In any case, in line 92 we adjusted the position of the objects so that they would be linked to the mouse pointer. However, if the objects are not present on the chart, the IsView value will be false. And in line 58 this will stop execution and immediately return control to the caller, which in this case is line 92. This will continue until the middle button is pressed, after which the crosshair will finally be created. From this moment on, updating will occur with every mouse movement, because in this case IsView will have the value true, allowing line 92 to update the position, since the condition on line 58 will no longer be met.
All right, but how can we make the crosshair disappear once it becomes visible? This depends on what you are going to use the crosshair for and how it will function. But without much effort and without using much code, we can add a key to hide the crosshair from the chart until this behavior is fully implemented. To do this, we changed the event-handling code to implement this method of removing the crosshair from the chart, as shown in the code fragment below.
                   .
                   .
                   .
082. //+------------------------------------------------------------------+
083. void OnChartEvent(const int id, const long &lparam, const double &dparam, const string &sparam)
084. {
085.
086.     switch (id)
087.     {
088.         case CHARTEVENT_KEYDOWN:
089.             if (TerminalInfoInteger(TERMINAL_KEYSTATE_ESCAPE)) gl_Cross.Hide();
090.             break;
091.         case CHARTEVENT_MOUSE_MOVE:
092.             if (((uchar)sparam & MOUSE_MIDDLE) != 0) gl_Cross.Show();
093.             gl_Cross.Move((ushort)lparam, (ushort)dparam);
094.             break;
095.         case CHARTEVENT_MOUSE_WHEEL:
096.             break;
097.     }
098.     ChartRedraw();
099. };
100. //+------------------------------------------------------------------+
                   .
                   .
                   .
Code 05
This simple change, which can be seen on line 89, allows us to do what is shown in the following animation.
Animation 04
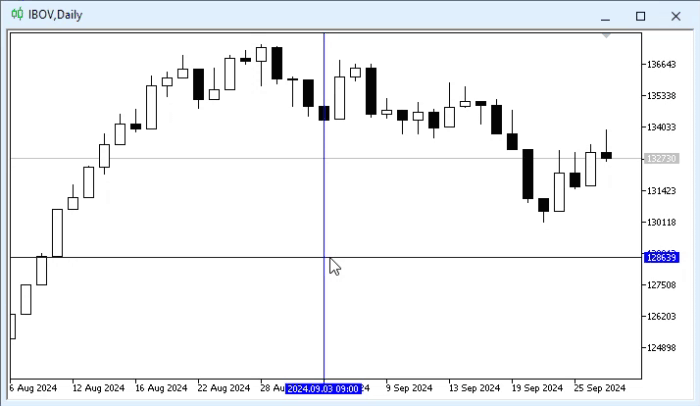
Notice that now we can show or hide the crosshair for analysis at our discretion. But here, in animation 04, an important issue arises: the contract tick size, that is, by how many points the price changes. Unlike many cases, this futures contract, in this case the dollar futures contract, changes not by one unit, but by 0.5. To check this, we can look at the contract specifications:
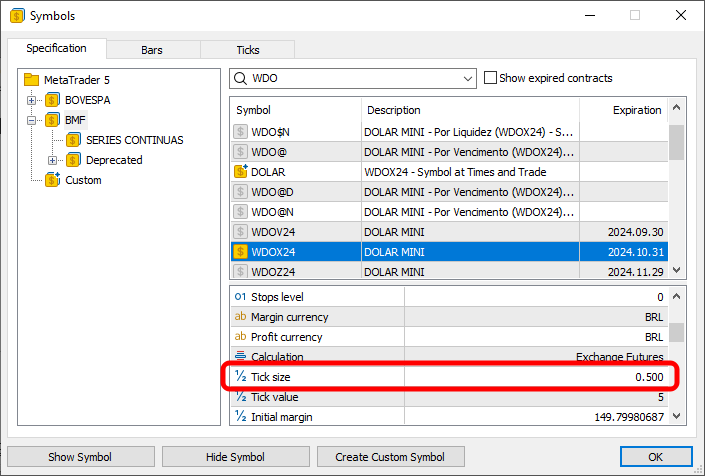
Image 02
And what does image 02 show us? In it, we see how much the symbol price changes. This is exactly what I want to emphasize here. This information is important so that we can develop a suitable method by which the price line will always reflect a valid market price. There is no point in specifying in the price line a value that will never be used. This is because such a value cannot be used, for example, to send orders.
To solve this problem, we need to change the code again. But this time we will not change the event handler; we will change the st_Cross structure, as shown below.
                   .
                   .
                   .

017. //+------------------------------------------------------------------+
018. struct st_Cross
019. {
020.     private :
021. //+----------------+
022.         bool    IsView;
023.         string  Objs[2];
024.         int     nDigits;
025.             double  PointPerTick;
026. //+----------------+
027.         void Create(char index, ENUM_OBJECT type)
028.         {
029.             ObjectCreate(0, Objs[index] = macro_NameObject, type, 0, 0, 0);
030.             ObjectSetString(0, Objs[index], OBJPROP_TOOLTIP, "\n");
031.             ObjectSetInteger(0, Objs[index], OBJPROP_COLOR, clrBlue);
032.         }
033. //+----------------+
034.     public  :
035. //+----------------+
036.         void Init(void)
037.         {
038.             nDigits         = (int) SymbolInfoInteger(_Symbol, SYMBOL_DIGITS);
039.             PointPerTick    = SymbolInfoDouble(_Symbol, SYMBOL_TRADE_TICK_SIZE);
040.             Hide();
041.         }
042. //+----------------+
                   .
                   .
                   .
060. //+----------------+
061.         void Move(short x, short y)
062.         {
063.             int         sub;
064.             datetime    dt;
065.             double      price;
066.
067.             if (!IsView) return;
068.             ChartXYToTimePrice(0, x, y, sub, dt, price);
069.             price = NormalizeDouble(MathRound(price / PointPerTick) * PointPerTick, nDigits);
070.             ObjectMove(0, Objs[0], 0, dt, price);
071.             ObjectMove(0, Objs[1], 0, dt, price);
072.             ChartRedraw();
073.         }
074. //+----------------+
075. }gl_Cross;
076. //+------------------------------------------------------------------+
077. int OnInit()
078. {
079.     gl_Cross.Init();
080.
081.     IndicatorSetString(INDICATOR_SHORTNAME, def_Prefix);
082.     ChartSetInteger(0, CHART_EVENT_MOUSE_MOVE, true);
083.     ChartSetInteger(0, CHART_CROSSHAIR_TOOL, false);
084.
085.     return INIT_SUCCEEDED;
086. };
087. //+------------------------------------------------------------------+
                   .
                   .
                   .
Code 06
Please note that we made very simple changes in code fragment 06. First, we add new variables to the structure. This helps us avoid constantly reading the same information. Immediately after that, we added a new procedure: Init. This happens on line 36, where we initialize the structure in a somewhat more appropriate way. Therefore, in the OnInit method, we changed the call that was previously made to the Hide procedure and redirected it to Init, as can be seen on line 79.
Now, to correct this deviation in the price line, we use line 69 to adjust the price accordingly. In the end, we see what is shown in the following animation:
Animation 05
Simply perfect. With extremely simple code, we managed to create our basic and fully customizable indicator. Now the question arises: what kinds of analysis can we perform using this indicator? because we have not focused on any specific type of analysis here. Well, dear reader, there is no simple answer to this question. This is because we can perform absolutely any kinds of analysis. It all depends on what we really want to achieve and how we plan to use what we have created later.
Remember that the content of these articles is educational in nature. And since none of the points considered here in any way corresponds to a predefined goal that we are trying to achieve, do not cling to one implementation method or another; just try to understand the concepts. And once you understand the concept, all that remains is to implement what you want or need.
How can we turn this indicator into something truly practical, incredibly interesting, and engaging? Let us do the following: move the st_Cross structure into a header file. This way, various indicators can be implemented with minimal effort. In addition, we can prepare it so that later it can become a class, when we start talking about classes. Thus, now we have two files. One of them is shown below — this is the header file.
01. //+------------------------------------------------------------------+
02. #property copyright "Daniel Jose"
03. //+------------------------------------------------------------------+
04. enum eBtnMouse  {
05.         MOUSE_LEFT      = 0x01,
06.         MOUSE_RIGHT     = 0x02,
07.         MOUSE_KEY_SHIFT = 0x04,
08.         MOUSE_KEY_CTRL  = 0x08,
09.         MOUSE_MIDDLE    = 0x10,
10.         MOUSE_EXTRA_1   = 0x20,
11.         MOUSE_EXTRA_2   = 0x40
12.                 };
13. //+------------------------------------------------------------------+
14. struct st_TimePrice
15. {
16.     double      Price;
17.     datetime    Time;
18. };
19. //+------------------------------------------------------------------+
20. struct st_Cross
21. {
22.     private :
23. //+----------------+
24.         bool    IsView;
25.         string  Objs[2];
26.         int     nDigits;
27.         double      PointPerTick;
28. //+----------------+
29.         void Create(char index, ENUM_OBJECT type)
30.         {
31.             ObjectCreate(0, Objs[index] = macro_NameObject, type, 0, 0, 0);
32.             ObjectSetString(0, Objs[index], OBJPROP_TOOLTIP, "\n");
33.             ObjectSetInteger(0, Objs[index], OBJPROP_COLOR, clrBlue);
34.         }
35. //+----------------+
36.     public  :
37. //+----------------+
38.         void Init(void)
39.         {
40.             nDigits         = (int) SymbolInfoInteger(_Symbol, SYMBOL_DIGITS);
41.             PointPerTick    = SymbolInfoDouble(_Symbol, SYMBOL_TRADE_TICK_SIZE);
42.             Hide();
43.         }
44. //+----------------+
45.         void Show(void)
46.         {
47.             if (IsView) return;
48.             Create(0, OBJ_VLINE);
49.             Create(1, OBJ_HLINE);
50.             IsView = true;
51.             ChartRedraw();
52.         }
53. //+----------------+
54.         void Hide(void)
55.         {
56.             if (!IsView) return;
57.             for(uint c = 0; c < Objs.Size(); c++)
58.                 ObjectDelete(0, Objs[c]);
59.             ChartRedraw();
60.             IsView = false;
61.         }
62. //+----------------+
63.         st_TimePrice Move(short x, short y)
64.         {
65.             int             sub;
66.             st_TimePrice    tp;
67.
68.             ChartXYToTimePrice(0, x, y, sub, tp.Time, tp.Price);
69.             tp.Price = NormalizeDouble(MathRound(tp.Price / PointPerTick) * PointPerTick, nDigits);
70.             if (IsView)
71.             {
72.                 ObjectMove(0, Objs[0], 0, tp.Time, tp.Price);
73.                 ObjectMove(0, Objs[1], 0, tp.Time, tp.Price);
74.                 ChartRedraw();
75.             }
76.
77.             return tp;
78.         }
79. //+----------------+
80. };
81. //+------------------------------------------------------------------+
Code 07
And this one corresponds to the indicator we want to implement:
01. //+------------------------------------------------------------------+
02. #property copyright "Daniel Jose"
03. //+------------------------------------------------------------------+
04. #define def_Prefix  "Demo"
05. //+------------------------------------------------------------------+
06. #define macro_NameObject  def_Prefix + (string)ObjectsTotal(0)
07. //+------------------------------------------------------------------+
08. #include <Tutorial\File 01.mqh>
09. //+------------------------------------------------------------------+
10. st_Cross gl_Cross;
11. //+------------------------------------------------------------------+
12. int OnInit()
13. {
14.     gl_Cross.Init();
15.
16.     IndicatorSetString(INDICATOR_SHORTNAME, def_Prefix);
17.     ChartSetInteger(0, CHART_EVENT_MOUSE_MOVE, true);
18.     ChartSetInteger(0, CHART_CROSSHAIR_TOOL, false);
19.
20.     return INIT_SUCCEEDED;
21. };
22. //+------------------------------------------------------------------+
23. int OnCalculate(const int rates_total, const int prev_calculated, const int begin, const double &price[])
24. {
25.     return rates_total;
26. };
27. //+------------------------------------------------------------------+
28. void OnChartEvent(const int id, const long &lparam, const double &dparam, const string &sparam)
29. {
30.
31.     switch (id)
32.     {
33.         case CHARTEVENT_KEYDOWN:
34.             if (TerminalInfoInteger(TERMINAL_KEYSTATE_ESCAPE)) gl_Cross.Hide();
35.             break;
36.         case CHARTEVENT_MOUSE_MOVE:
37.             if (((uchar)sparam & MOUSE_MIDDLE) != 0) gl_Cross.Show();
38.             gl_Cross.Move((ushort)lparam, (ushort)dparam);
39.             break;
40.         case CHARTEVENT_MOUSE_WHEEL:
41.             break;
42.     }
43.     ChartRedraw();
44. };
45. //+------------------------------------------------------------------+
46. void OnDeinit(const int reason)
47. {
48.     ChartSetInteger(0, CHART_EVENT_MOUSE_MOVE, false);
49.     ChartSetInteger(0, CHART_CROSSHAIR_TOOL, true);
50.
51.     gl_Cross.Hide();
52. };
53. //+------------------------------------------------------------------+
Code 08
Please note that in code 07 we added a new structure. Its purpose is to return the current value based on the movement and position of the mouse. And in code 08, note that the header file is added after the definitions. This is important so that the file can be compiled. Thanks to this, we now have something to work on for quite a long time.
So, let us start with a relatively simple and inexpensive indicator. I say "inexpensive" because it does not require much effort to implement, only a little attention. But to properly separate the material, let us move on to a new topic.
Trendline indicator
One of the simplest, most inexpensive, and least costly indicators is a trendline. Consider this example: we want to create an indicator that allows trendlines to be added without needing to select this object in the MetaTrader 5 menu. So, we decide to create an indicator to optimize this type of activity. Based on code 08, which is a reliable tool for creating all other types of indicators that use objects, we will make small changes to the code in order to create an indicator that uses a trendline.
01. //+------------------------------------------------------------------+
02. #property copyright "Daniel Jose"
03. //+------------------------------------------------------------------+
04. #define def_Prefix  "Demo"
05. //+------------------------------------------------------------------+
06. #define macro_NameObject  def_Prefix + (string)ObjectsTotal(0)
07. //+------------------------------------------------------------------+
08. #include <Tutorial\File 01.mqh>
09. //+------------------------------------------------------------------+
10. st_Cross gl_Cross;
11. //+------------------------------------------------------------------+
12. int OnInit()
13. {
14.     gl_Cross.Init();
15.
16.     IndicatorSetString(INDICATOR_SHORTNAME, def_Prefix);
17.     ChartSetInteger(0, CHART_EVENT_MOUSE_MOVE, true);
18.     ChartSetInteger(0, CHART_CROSSHAIR_TOOL, false);
19.
20.     return INIT_SUCCEEDED;
21. };
22. //+------------------------------------------------------------------+
23. int OnCalculate(const int rates_total, const int prev_calculated, const int begin, const double &price[])
24. {
25.     return rates_total;
26. };
27. //+------------------------------------------------------------------+
28. void OnChartEvent(const int id, const long &lparam, const double &dparam, const string &sparam)
29. {
30.     st_TimePrice tp;
31.     static string isPaint = "";
32.
33.     switch (id)
34.     {
35.         case CHARTEVENT_KEYDOWN:
36.             if (TerminalInfoInteger(TERMINAL_KEYSTATE_ESCAPE)) gl_Cross.Hide();
37.             break;
38.         case CHARTEVENT_MOUSE_MOVE:
39.             if (((uchar)sparam & MOUSE_MIDDLE) != 0)
40.             {
41.                 gl_Cross.Show();
42.                 tp = gl_Cross.Move((ushort)lparam, (ushort)dparam);
43.                 if (isPaint == "")
44.                 {
45.                     ObjectCreate(0, isPaint = macro_NameObject, OBJ_TREND, 0, tp.Time, tp.Price);
46.                     ObjectSetInteger(0, isPaint, OBJPROP_SELECTABLE, true);
47.                     ObjectSetInteger(0, isPaint, OBJPROP_COLOR, clrMagenta);
48.                     ObjectSetInteger(0, isPaint, OBJPROP_WIDTH, 3);
49.                     ObjectSetInteger(0, isPaint, OBJPROP_RAY_RIGHT, true);
50.                 }
51.                 ObjectMove(0, isPaint, 1, tp.Time, tp.Price);
52.             }else
53.             {
54.                 isPaint = "";
55.                 gl_Cross.Hide();
56.             }
57.             break;
58.         case CHARTEVENT_MOUSE_WHEEL:
59.             break;
60.     }
61.     ChartRedraw();
62. };
63. //+------------------------------------------------------------------+
64. void OnDeinit(const int reason)
65. {
66.     ChartSetInteger(0, CHART_EVENT_MOUSE_MOVE, false);
67.     ChartSetInteger(0, CHART_CROSSHAIR_TOOL, true);
68.
69.     gl_Cross.Hide();
70.
71.     if (reason == REASON_REMOVE)
72.         ObjectsDeleteAll(0, def_Prefix);
73. };
74. //+------------------------------------------------------------------+
Code 09
Code 09 will help explain something that many beginners do not know.
In programming, the order of the factors changes the product.
This simple phrase, which seems to have no influence on most decisions made in the life of every programmer, is an ultimate truth unknown to many beginners. This is exactly so, because if we run code 09 on the chart, we will get what we see below:
Animation 06
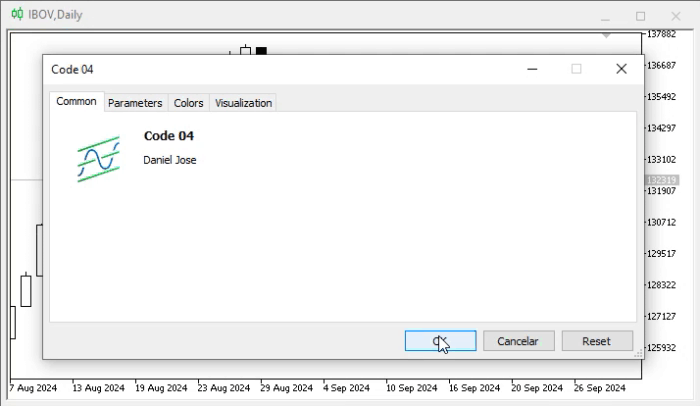
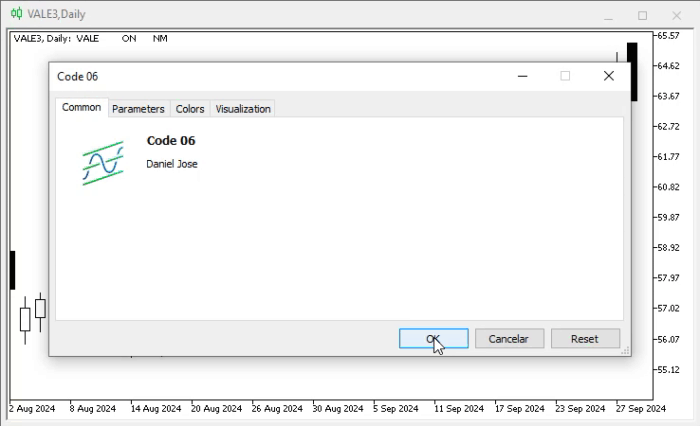
In other words, our idea works. But you may think: what if I want to change the construction of the trendline for some reason? How can I do that? This is the simplest part, dear reader. Usually, to select an object, you need to double-click it. But if you change the parameter shown in the next image, only one click will be required to select the object.
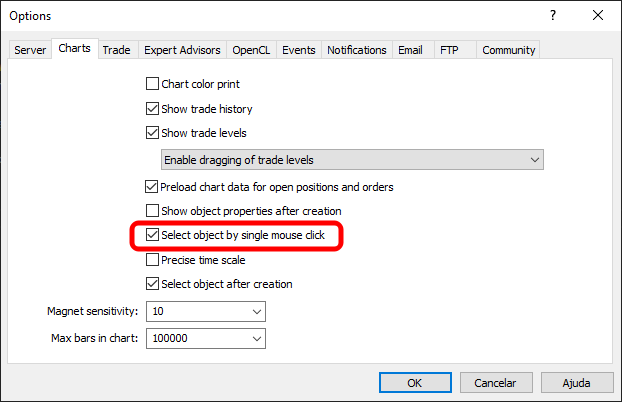
Image 03
Remember that this will apply only to selectable objects. But we will talk about this in more detail later. For now, all objects are initially selectable in MetaTrader 5. All right, using the option marked in image 03, as shown, we can do the following:
Animation 07
In other words, we immediately feel proud that we managed to make one code from another. But even so, there is a drawback here. If we try to create a new trendline, as shown in the animation below, look what happens:
Animation 08
"Oh, now I do not understand anything. How strange. Why was the previous trendline deleted? And why did one of the intersecting lines not appear when we tried to create a new trendline? This situation is very strange. I did not expect this to happen, since judging by animation 06 the code seemed to work perfectly." So, dear reader, the problem is that the objects are created in the wrong order. It sounds strange. But yes, what we see in animation 08 is precisely the consequence of creating objects in the wrong order.
If you look at code 09, you will notice that first we created the crosshair. This is done on line 41. Immediately after that, on line 45, we built the trendline. There will be no problem with such a creation sequence, provided of course that no attempt is made to create a new object. When this happens, as can be seen in animation 08, we have a problem. Although in fact two problems would arise. The first problem is that the macro on line 6 of code 09 does not check for objects already existing on the chart. Therefore, if objects are listed with the same prefix, at some point we will encounter an object already present on the chart.
But how is this possible? All right, let us assume that initially there are no objects on the chart. After creating the crosshair, we will have two objects: one will be named "Demo0", and the other "Demo1". Everything is going well. When the trendline is created on line 45 of code 09, we will have a third object, "Demo2".
Now we have reached the point corresponding to the line shown in animation 06. When attempting to create a new trendline, the crosshair will try to create the objects “Demo1” and “Demo2”. But wait a minute: there is already an object on the chart named "Demo2", which represents the previous trendline. Yes, dear reader, this is precisely why one of the crosshair lines will not be created. And this creates what can be seen at the beginning of animation 08. However, if the crosshair is removed, then both "Demo1" and "Demo2" will disappear, and with them the previous trendline. And at that moment there will no longer be any objects on the chart, which returns us to the initial state for building the trendline.
It should be noted that the first problem arose because of counting the objects present on the chart. But the second problem is related to the order in which objects are created. Therefore, to eliminate both problems, we need to change code 09 and leave it in this form:
01. //+------------------------------------------------------------------+
02. #property copyright "Daniel Jose"
03. //+------------------------------------------------------------------+
04. #define def_Prefix  "Demo"
05. //+------------------------------------------------------------------+
06. #define macro_NameObject  def_Prefix + (string)(ObjectsTotal(0) + 1)
07. //+------------------------------------------------------------------+
08. #include <Tutorial\File 01.mqh>
09. //+------------------------------------------------------------------+
10. st_Cross gl_Cross;
11. //+------------------------------------------------------------------+
12. int OnInit()
13. {
14.     gl_Cross.Init();
15.
16.     IndicatorSetString(INDICATOR_SHORTNAME, def_Prefix);
17.     ChartSetInteger(0, CHART_EVENT_MOUSE_MOVE, true);
18.     ChartSetInteger(0, CHART_CROSSHAIR_TOOL, false);
19.
20.     return INIT_SUCCEEDED;
21. };
22. //+------------------------------------------------------------------+
23. int OnCalculate(const int rates_total, const int prev_calculated, const int begin, const double &price[])
24. {
25.     return rates_total;
26. };
27. //+------------------------------------------------------------------+
28. void OnChartEvent(const int id, const long &lparam, const double &dparam, const string &sparam)
29. {
30.     st_TimePrice tp;
31.     static string isPaint = "";
32.
33.     switch (id)
34.     {
35.         case CHARTEVENT_KEYDOWN:
36.             if (TerminalInfoInteger(TERMINAL_KEYSTATE_ESCAPE)) gl_Cross.Hide();
37.             break;
38.         case CHARTEVENT_MOUSE_MOVE:
39.             if (((uchar)sparam & MOUSE_MIDDLE) != 0)
40.             {
41.                 tp = gl_Cross.Move((ushort)lparam, (ushort)dparam);
42.                 if (isPaint == "")
43.                 {
44.                     ObjectCreate(0, isPaint = macro_NameObject, OBJ_TREND, 0, tp.Time, tp.Price);
45.                     ObjectSetInteger(0, isPaint, OBJPROP_SELECTABLE, true);
46.                     ObjectSetInteger(0, isPaint, OBJPROP_COLOR, clrMagenta);
47.                     ObjectSetInteger(0, isPaint, OBJPROP_WIDTH, 3);
48.                     ObjectSetInteger(0, isPaint, OBJPROP_RAY_RIGHT, true);
49.                 }
50.                 ObjectMove(0, isPaint, 1, tp.Time, tp.Price);
51.                 gl_Cross.Show();
52.             }else
53.             {
54.                 isPaint = "";
55.                 gl_Cross.Hide();
56.             }
57.             break;
58.         case CHARTEVENT_MOUSE_WHEEL:
59.             break;
60.     }
61.     ChartRedraw();
62. };
63. //+------------------------------------------------------------------+
64. void OnDeinit(const int reason)
65. {
66.     ChartSetInteger(0, CHART_EVENT_MOUSE_MOVE, false);
67.     ChartSetInteger(0, CHART_CROSSHAIR_TOOL, true);
68.
69.     gl_Cross.Hide();
70.
71.     if (reason == REASON_REMOVE)
72.         ObjectsDeleteAll(0, def_Prefix);
73. };
74. //+------------------------------------------------------------------+
Code 10
After running code 10, we will see the result in the following animation:
Animation 09
Please note that now we can add as many trendlines as we want. And this happens without any problems, because line 06 of code 10 fixes the name-conflict problem. And the crosshair is displayed only after the trendline that will be placed on the chart is created. This can be seen on line 51, where we actually created a simple crosshair for analysis. In other words, a simple change in the execution order allowed us to solve the second problem that prevented the desired object from remaining on the chart.
Final thoughts
In this article, we looked at how to implement in practice what many consider difficult or, at the very least, cannot find a practical way to implement — working directly with objects in an indicator, placing them on the chart, and then using them.
Indeed, here we showed how to work with a relatively simple object, namely a trendline. But do not think that, despite this, the application presented here is useless. You can use what was shown here to train and practice various skills while trying to develop an application that will actually be useful to you, dear reader. Try to study it and see what can be improved in what was shown in this article.
Remember that we are not yet working with classes, which makes the task even more interesting. Depending on how you plan to implement your solutions, you will begin to notice that some aspects of their implementation can be improved. These points lead us to a new programming style that has not yet been presented in this short series of articles, but which will soon enter our repertoire.
So, enjoy the codes in the attachment, and see you in the next article, where we will look at how to perform other manipulations with objects on the chart.
| MQ5 file | Description |
|---|---|
| Code 01 | Object demonstration |
Translated from Portuguese by MetaQuotes Ltd.
Original article: https://www.mql5.com/pt/articles/16021
Warning: All rights to these materials are reserved by MetaQuotes Ltd. Copying or reprinting of these materials in whole or in part is prohibited.
This article was written by a user of the site and reflects their personal views. MetaQuotes Ltd is not responsible for the accuracy of the information presented, nor for any consequences resulting from the use of the solutions, strategies or recommendations described.

- Free trading apps
- Over 8,000 signals for copying
- Economic news for exploring financial markets
You agree to website policy and terms of use