
Secrets of the MetaTrader 4 Client Terminal: Indicators

One cannot imagine the analysis of financial markets without technical indicators at the present time. You can create your own indicators or use the embedded ones. The embedded indicators work faster than the custom ones and have a number of features that cannot be implemented in custom indicators. For example, there are indicators that can be attached to a chart both in the main window and in a subwindow. Besides, indicator can be calculated not on price and/or volume values, but on the values of another indicator.
Clever use of the embedded indicators will help to go far without diving into programming the own ones.
There are thirty embedded indicators in the MetaTrader 4 Client Terminal. Conditionally, all indicators can be divided into four groups:
- oscillators;
- trend indicators;
- Bill Williams' indicators;
- volumes.
Trend indicators help to allocate price movement in one direction and detect, synchroniously or delayed, the moments when trends turn. Oscillators allow to detect such turns synchroniously or in advance. Bill Williams' indicators have properties of both oscillators and trend indicators. Volumes analyze not the price movements as they are, but the amount of ticks that have income during the bar.
Summary Table of Embedded Indicators Characteristics
Using the links in the table, you can view the code source of a custom indicator that correponds with the embedded one.
| Indicator | Accepted Abbreviation | Type | Separate/ Main |
Association with s / m |
Additional lines | Period/ Shift |
Apply to | MA Method | Levels |
| Acceleration/Deceleration Oscillator | AC | b | s | +/- | - | -/- | - | - | + |
| Accumulation/Distribution | A/D | v | s | +/- | - | -/- | - | - | + |
| Alligator | Alligator | b | m | -/+ | - | +/+ | + | + | - |
| Average Directional Movement Index | ADX | t | s | +/- | - | +/- | + | - | + |
| Average True Range | ATR | o | s | +/- | - | +/- | - | - | + |
| Awesome Oscillator | AO | b | s | +/- | - | -/- | - | - | + |
| Bears Power | Bears | o | s | +/- | - | +/- | + | - | + |
| Bollinger Bands | BB | t | m | +/+ | + | +/+ | + | - | + |
| Bulls Power | Bulls | o | s | +/- | - | +/- | + | - | + |
| Commodity Channel Index | CCI | t | s | +/+ | + | +/- | + | - | + |
| DeMarker | DeM | o | s | +/- | - | +/- | - | - | + |
| Envelopes | Env | o | m | +/+ | + | +/+ | + | + | + |
| Force Index | FRC | o | s | +/- | - | +/- | + | + | + |
| Fractals | Fractals | b | m | -/+ | - | -/- | - | - | - |
| Gator Oscillator | Gator | b | s | +/- | - | +/+ | + | + | + |
| Ichimoku Kinko Hyo | Ishimoku | o | m | -/+ | - | +/- | - | - | - |
| Market Facilitation Index | BW MFI | b | s | +/- | - | -/- | - | - | + |
| Momentum | Momentum | o | s | +/+ | + | +/- | + | - | + |
| Money Flow Index | MFI | v | s | +/- | - | +/- | - | - | + |
| Moving Average | MA | t | m | +/+ | + | +/+ | + | + | + |
| Moving Average Convergence/Divergence | MACD | o | s | +/- | - | +/- | + | - | + |
| Moving Average of Oscillator | OsMA | o | s | +/- | - | +/- | + | - | + |
| On Balance Volume | OBV | v | s | +/- | - | -/- | + | - | + |
| Parabolic SAR | Parabolic | t | m | -/+ | - | +/- | - | - | - |
| Relative Strength Index | RSI | o | s | +/+ | + | +/- | + | - | + |
| Relative Vigor Index | RVI | o | s | +/- | - | +/- | - | - | + |
| Standard Deviation | StdDev | t | s | +/+ | + | +/+ | + | + | + |
| Stochastic Oscillator | Stochastic | o | s | +/- | - | +/+ | + | + | + |
| Volumes | Volumes | v | s | +/- | - | -/- | - | - | + |
| Williams’ Percent Range | %R | o | s | +/- | - | +/- | - | - | + |
Type
- o – oscillator;
- t – trend indicator;
- b – Bill Williams' indicator;
- v – volume.
Separate/main
- s – indicator is attached in a subwindow by default;
- m – indicator is attached in the main window by default.
Association with s/m: Whether the indicator can or not be associated with the indicator already attached in a subwindow (s) or in the main window (m).
Additional lines: Additional lines, Previous Indicator's Data and First Indicator's Data, appear in the "Apply to" field in the indicator's properties window when the indicator is being dragged.
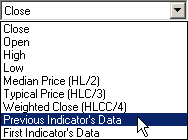
Previous Indicator's Data - data of the latest indicator attached to the main window or to a subwindow. If there are no attached indicators, the Previous Indicator's Data are the chart data. And the indicator to be attached will be built based on the Close price of the chart.
First Indicator's Data - data of the indicator that was attached as the first to the main window or to a subwindow. If there are no attached indicators, the First Indicator's Data are the chart data. And the indicator to be attached will be built based on the Close price of the chart.
Period/shift: Availability of fields with corresponding names in the "Parameters" tab of the indicator's properties window.
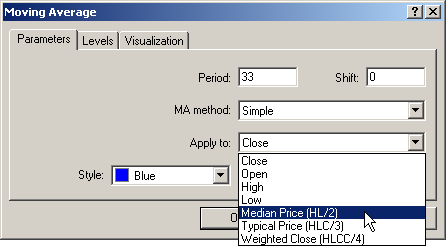
Apply to: Availability of the "Apply to" field in the "Parameters" tab of the indicator's properties window.
МА Method: Availability of the field of the same name in the "Parameters" tab (choice of moving average building method).
Levels: Availability of the "Levels" tab.
How to Attach Indicators to a Chart
An indicator can be attached to a chart in six ways:
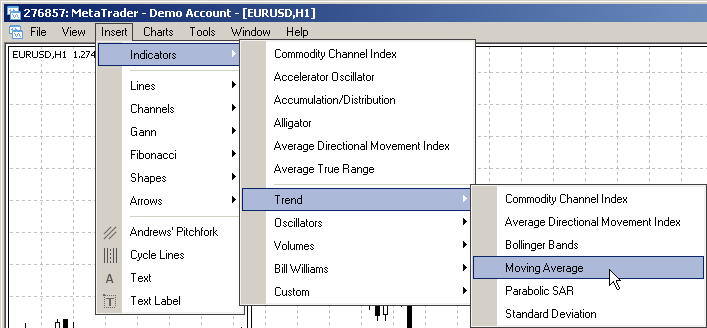
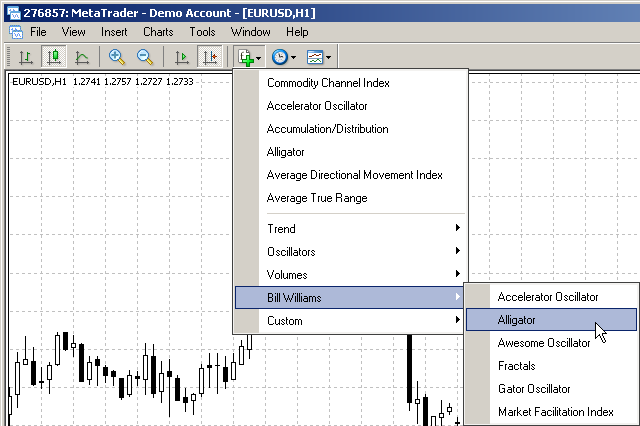
- using the main menu command:
- using button

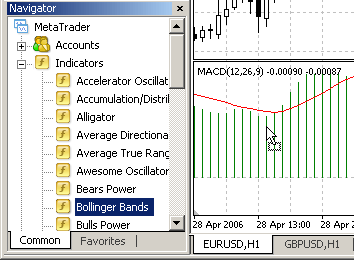
- double-clicking on the indicator name in the "Navigator" window;
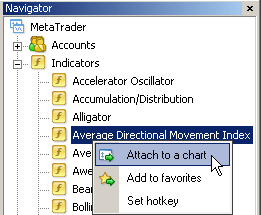
- selecting the "Navigator" window context menu command:
- using the preset hot keys;
- dragging the indicator with the mouse into the main window or into the other indicator's
subwindow (drag-and-drop).
The first five ways do not differ from each other fundamentally. Let us call them default modes of indicator attaching. At this, the indicator will be drawn either in the chart or in a separate subwindow, as by default.The fifth method, the dragging, is more interesting. Some indicators, when dragged into the chart, can be calculated from values of another indicator already attached to the chart. There are seven "special" indicators:
- Bollinger Bands;
- Commodity Channel Index;
- Envelopes;
- Momentum;
- Moving Average;
- Relative Strength Index;
- Standard Deviation.
Embedded indicators can be combined with other indicators or calculated on values of other indicators. At combining, the indicator to be attached is just displayed over the indicator already attached, but has its own scale and borders. In this case, the values of the indicator to be attached are calculated from the chart price values.
An embedded indicator that is displayed in a subwindow by default can be combined with the indicator already attached in the subwindow.An embedded indicator that is displayed in the main window by default can be combined with the indicator already attached in the main window.
Most embedded indicators can only be attached as in the default mode. Those seven "special" indicators can be attached both to the main window and to a subwindow.
How to Attach to the Main Window Indicators that Are Opened in a Subwindow by Default
Indicators below are opened in a subwindow by default:
- Commodity Channel Index
- Momentum
- Relative Strength Index
- Standard Deviation
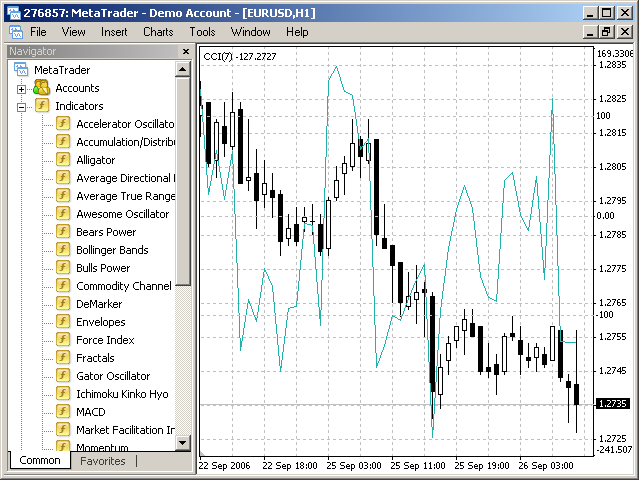
Let us study properties of these indicators by the example of Commodity Channel Index.
As it was already mentioned above, this indicator will be opened in a separate window
by default:
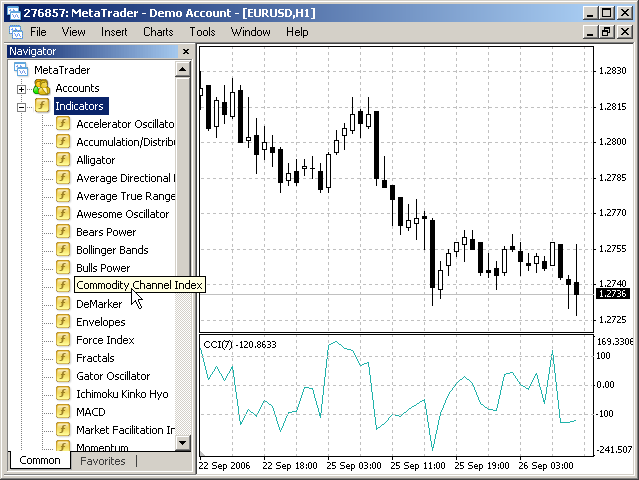
To attach CCI to the main window, one has to drag it to the chart. The indicator's
properties will look as given below:

Actually, the chart is at the same time the indicator. So, if no other indicators are available, First Indicator's Data and Previous Indicator's Data - are data of the chart itself, and the drawing method on the previous indicator's values does not differ from that on the first indicator's values in any way.
Thus, to attach indicator into the chart window, one has to drag-and-drop it to the chart and select First Indicator's Data or Previous Indicator's Data.
The obtained result:
Indicators Momentum, Relative Strength Index and Standard Deviation are attached to the chart window in the same way.
How to Attach to a Subwindow Indicators that Are Opened in the Main Window by Default
Indicators of this group are listed below:
- Bollinger Bands;
- Envelopes;
- Moving Average.
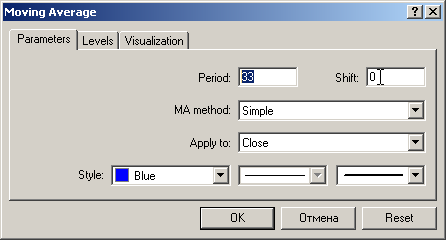
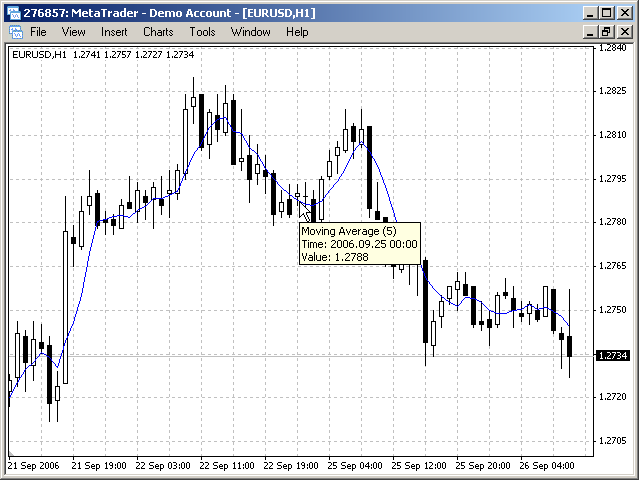
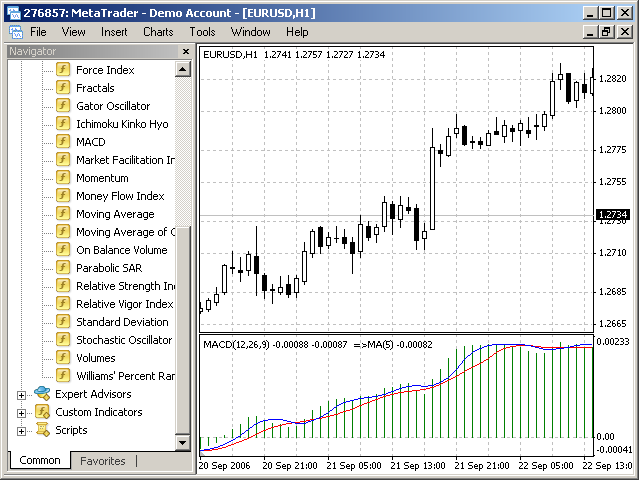
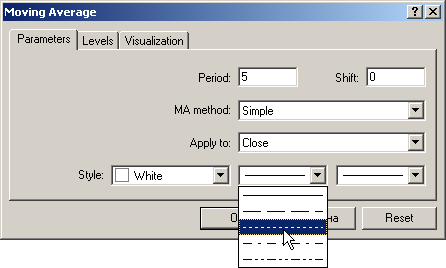
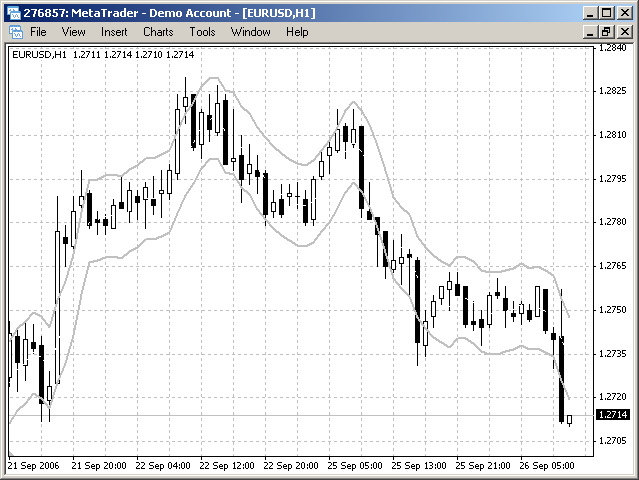
Let us consider Moving Average as an example. By default, this indicator looks as follows:
Attachment of the MA to a separate subwindow, it is necessary to make some more actions than for the previous example.
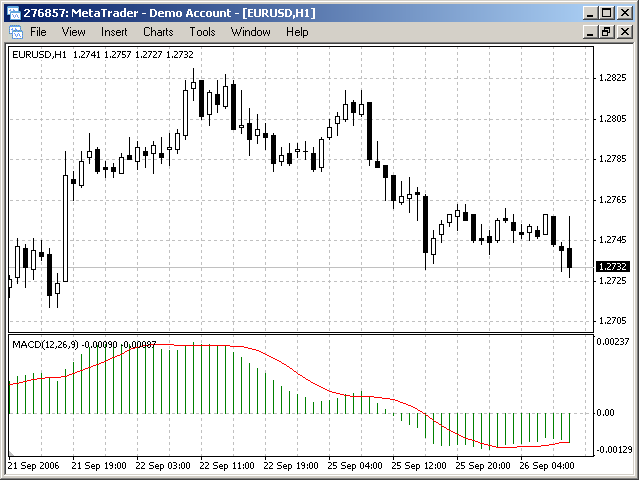
First of all, a separate window must be "created". For this, let us attach to the chart any indicator that can be opened in a subwindow. For example, MACD.
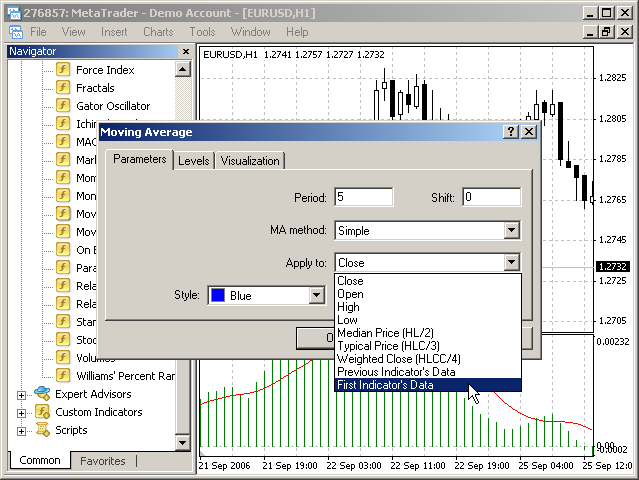
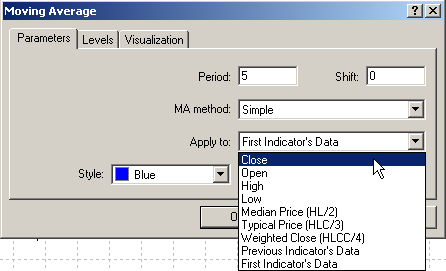
Now, we can drag the Moving Average into the MACD window and select Previous Indicator's Data or First Indicator's Data in the properties window (since there is only one indicator in the subwindow, the MACD, it will be both the first and the last indicator).
When a number of indicators are attached to one subwindow, it is always possible to detect, which of them on which is built. Selection of Previous Indicator's Data is displayed as "->", that of First Indicator's Data - as "=>".
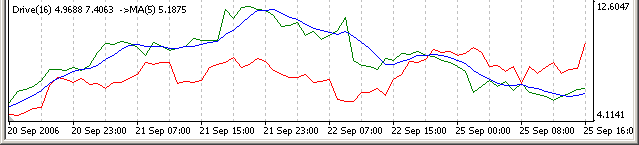
We have obtained MACD with Moving Average superimposed on it. We can stop at this, but we can also do so that only Moving Average will remain in the window. To do so, it is necessary to remove MACD. But, if we just remove it, the Moving Average, as indicator built on the MACD values, will be removed, as well. So, let us detach Moving Average from MACD first. Let us calculate on, for example, Close values.
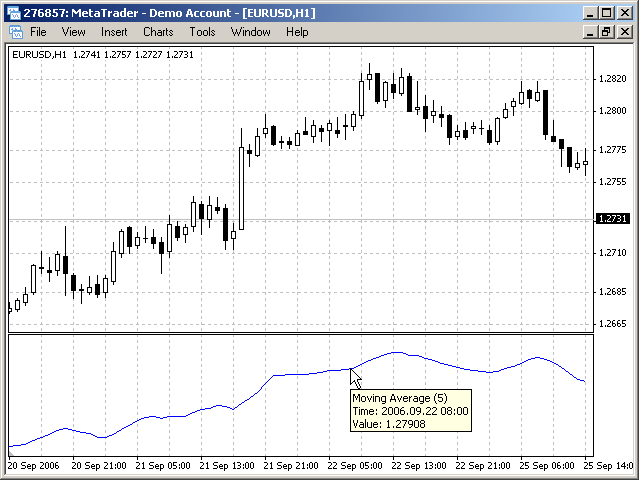
Now, the MACD can be removed, the Moving Average will remain in the separate window.
Thus, combining properties of different indicators, one can build a rather complicated system.
Some Common Properties of Indicators Attaching
- If the indicator to be attached is calculated on values of the indicator that has
several lines (more than one), it will be calculated on values of zero line or
the main line. In the code, this line is detected using values of the first parameter
of the SetIndexStyle function. So, for example, if the indicator to be attached is calculated on the
MACD, the histogram values will be taken as the values for calculations since it
is determined in the MACD code: SetIndexStyle(0, DRAW_HISTOGRAM).
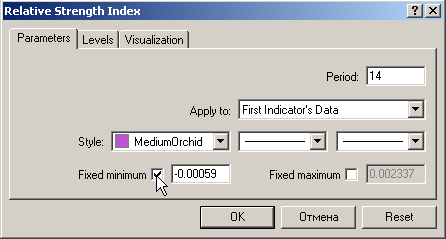
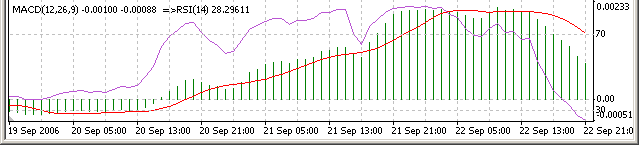
- Many indicators have, by default, fixed maximum and minimum, for example, RSI has.
In this case, after it has been attached to another indicator, for example, MACD,
their borders can misalign, i.e., RSI just will not match the MACD window.
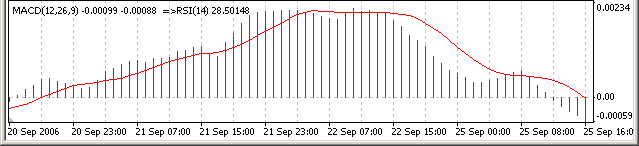
To correct this, it is necessary to uncheck the fields of maximum and minimum, and the indicators' scales will be independent on each other.
- When a number of indicators are attached to one subwindow, it is always possible
to detect, which of them on which is built. Selection of Previous Indicator's Data
is displayed as "->", that of First Indicator's Data - as "=>".
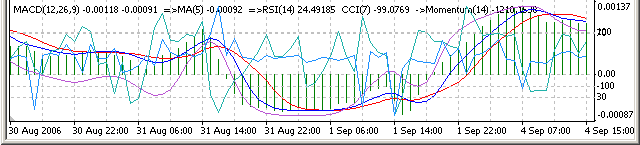
In the above example, the indicators are built in the following way:
- attached MACD;
- calculated MA on the First Indicator's Data, i.e., on values of the MACD;
- calculated RSI on the First Indicator's Data, i.e., again on values of the MACD;
- combined CCI with MACD;
- calculated Momentum on the Previous Indicator's Data, i.e., on values of the CCI.
- Embedded indicators can be superposed onto not only other embedded indicators, but
also onto custom indicators. The attaching principles are the same. For example:
How to Build Levels
Some indicators allow building of levels. For MA, one can build a channel using levels. To do so, it is necessary to go to the "Levels" tab and set some values using the "Add" button.
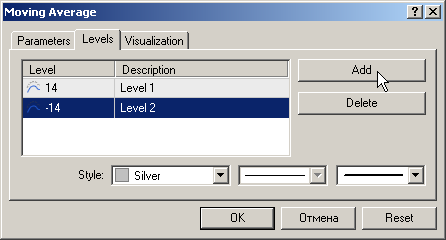
Now, if we make the MA line colored the same as the background, we will obtain channel built on the moving average.
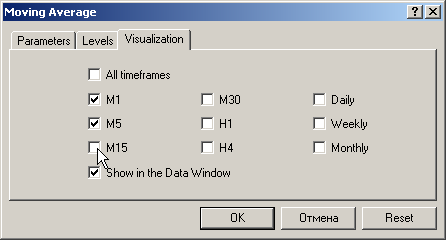
"Visualization" Tab
In the end, let us consider one more property of indicators in the MetaTrader 4 Client Terminal. All indicators, both embedded and custom ones, have this property. Moreover, it can apply to objects, as well, i.e., to graphical and technical analytical tools.
There is no secret that data analyzed on different timeframes of the same symbol can differ. Different technical tools can be used, including different indicators with different settings. The following can be done in order not to re-adjust indicators again and again when switching between timeframes: Specify in the indicator properties window that timeframe, to which the selected indicator will be anchored.
And so on for all indicators and on all timeframes. In future, when switching between them, we will be able to see different indicators on different timeframes. It remains just to save the template to be used in future for other symbols.
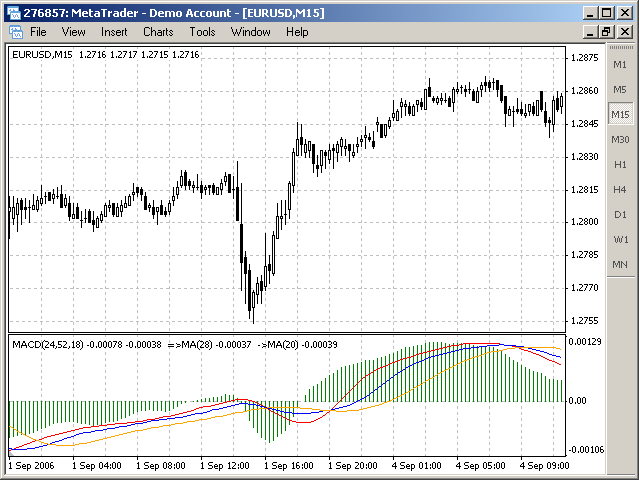
Example: On timeframes of H1 and M15, the same indicators, MACD and MA, are attached, but with different periods.
- On H1: MACD with values of 12, 26, 9; MA with the period of 7 is calculated on the MACD; MA with the period of 5 is calculated on the MA(7).
- On M15: MACD with values of 24, 52, 18; MA with the period of 28 is calculated on the MACD; MA with the period of 20 is calculated on the MA(28).

Translated from Russian by MetaQuotes Ltd.
Original article: https://www.mql5.com/ru/articles/1422
Warning: All rights to these materials are reserved by MetaQuotes Ltd. Copying or reprinting of these materials in whole or in part is prohibited.
This article was written by a user of the site and reflects their personal views. MetaQuotes Ltd is not responsible for the accuracy of the information presented, nor for any consequences resulting from the use of the solutions, strategies or recommendations described.

 Multiple Null Bar Re-Count in Some Indicators
 Testing of Expert Advisors in the MetaTrader 4 Client Terminal: An Outward Glance
 Ten Basic Errors of a Newcomer in Trading
 Secrets of MetaTrader 4 Client Terminal: Alerting System
- Free trading apps
- Over 8,000 signals for copying
- Economic news for exploring financial markets
You agree to website policy and terms of use
Would it be possible using the embedded indicators to get a MACD in a subwindow that uses RSI as its data source?
Great article!
Thanks,
Ace
If you don't know how to program or code custom indicators, try a graphical environment / code generator. No coding is required. No need to know/learn how to program in MQL.
You can download it here: http://www.molanis.com/products/molanis-technical-indicator-builder/forex-technical-indicator-builder-download
And read more about it here: http://www.molanis.com/products/molanis-technical-indicator-builder/custom-indicator-design
Features and Benefits