Join our fan page

Bears Power - indicator for MetaTrader 4

Use the links below to download the latest builds:
- Views:
- 36821
- Rating:
- Published:
- Updated:
-
 You are missing trading opportunities:
- Free trading apps
- Over 8,000 signals for copying
- Economic news for exploring financial markets
Registration Log inYou agree to website policy and terms of use
If you do not have an account, please register -
 Need a robot or indicator based on this code? Order it on Freelance
Go to Freelance
Need a robot or indicator based on this code? Order it on Freelance
Go to Freelance
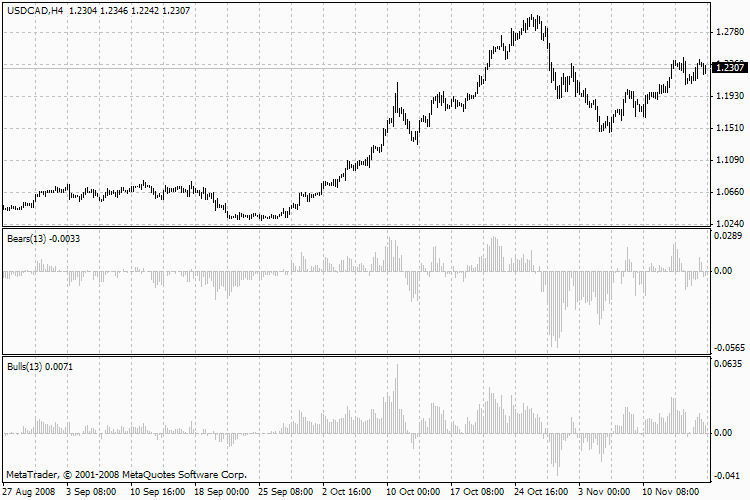
Elder-Rays Technical Indicator combine the properties of trend following indicators and oscillators. They use Exponential Moving Average indicator (EMA, the best period is 13) as a tracing indicator. The oscillators reflect the power of bulls and bears.To plot the Elder-Rays three charts should be used: on one side, the price chart and Exponential Moving Average will be plotted, on two other sides bulls power oscillator (Bulls Power) and bears power oscillator (Bears Power) will be plotted.
Bears Power, Bears
Elder-rays are used both
individually and together with other methods. If using them
individually, one should take into account that the Exponential Moving
Average slope determines the trend movement, and position should be
opened in its direction. Bulls and bears power oscillators are applied
for defining the moment of positions opening/closing.
Buy if:
there is an increasing trend (determined with the Exponential Moving Average movement);
the Bears Power oscillator is negative, but increasing at the same time;
the last peak of the Bulls Power oscillator is higher than the previous one;
the Bears Power oscillator increases after the Bulls divergence.
At the positive values of the Bears Power oscillator, it is better to keep back.
Sell if:
there is a decreasing trend (determined with the Exponential Moving Average movement);
the Bulls Power oscillator is positive, but decreases gradually;
the last trough of the Bulls Power oscillator is lower than the previous one;
the Bulls Power oscillator decreases leaving the Bears’ divergence.
Do not open short positions when the Bulls Power oscillator is negative. Divergence between the Bulls and Bears Power and prices is the best time for trading.
Translated from Russian by MetaQuotes Ltd.
Original code: https://www.mql5.com/ru/code/7825
Bollinger Bands, BB
Bollinger Bands ® Indicator (Bollinger Bands, BB) is plotted a certain number of standard deviations
Awesome Oscillator (AO)
Awesome Oscillator (AO) is a 34-period simple Moving Average, which is subtracted from the 5-period simple Moving Average.
Bulls Power
Bulls power oscillator (Bulls Power, Bulls) - trend following indicator.
Commodity Channel Index, CCI
Commodity Channel Index (CCI) indicator measures the deviation of the commodity price from its average statistical price.