Join our fan page

Parabolic SAR, Parabolic - indicator for MetaTrader 4

- Views:
- 56864
- Rating:
- Published:
- Updated:
-
 You are missing trading opportunities:
- Free trading apps
- Over 8,000 signals for copying
- Economic news for exploring financial markets
Registration Log inYou agree to website policy and terms of use
If you do not have an account, please register -
 Need a robot or indicator based on this code? Order it on Freelance
Go to Freelance
Need a robot or indicator based on this code? Order it on Freelance
Go to Freelance
Parabolic SAR Technical Indicator was developed for analyzing the trending markets. The indicator is constructed on the price chart. This indicator is similar to the Moving Average Indicator with the only difference that Parabolic SAR moves with higher acceleration and may change its position in terms of the price. The indicator is below the prices on the bull market (Up Trend), when it’s bearish (Down Trend), it is above the prices.
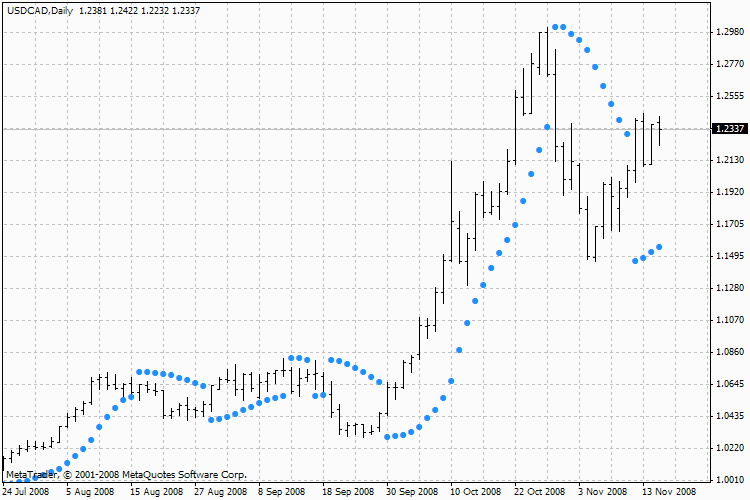
If the price crosses Parabolic SAR lines, the indicator turns, and its further values are situated on the other side of the price. When such an indicator turn does take place, the maximum or the minimum price for the previous period would serve as the starting point. When the indicator makes a turn, it gives a signal of the trend end (correction stage or flat), or of its turn.
The Parabolic SAR is an outstanding indicator for providing exit points. Long positions should be closed when the price sinks below the SAR line, short positions should be closed when the price rises above the SAR line. It is often the case that the indicator serves as a trailing stop line.
If the long position is open (i.e., the price is above the SAR line), the Parabolic SAR line will go up, regardless of what direction the prices take. The length of the SAR line movement depends on the scale of the price movement.
Calculation
SAR(i) = SAR(i-1)+ACCELERATION*(EPRICE(i-1)-SAR(i-1))
Where:
SAR(i-1) — is the value of the indicator on the previous bar;
ACCELERATION — is the acceleration factor;
EPRICE(i-1) — is the highest (lowest) price for the previous period (EPRICE=HIGH for long positions and EPRICE=LOW for short positions).
The indicator value increases if the price of the current bar is higher than previous bullish and vice versa. The acceleration factor (ACCELERATION) will double at the same time, which would cause Parabolic SAR and the price to come together. In other words, the faster the price grows or sinks, the faster the indicator approaches the price.
Technical Indicator Description
Full description of Parabolic is available in the Technical analysis: Parabolic SAR
Moving Average of Oscillator, OsMA
Moving Average of Oscillator is the difference between the oscillator and oscillator smoothing.
Moving Averages, MA
The Moving Average Indicator shows the mean instrument price value for a certain period of time.
Relative Strength Index (RSI)
The Relative Strength Index (RSI) technical indicator is a price-following oscillator that ranges between 0 and 100.
Stochastic Oscillator
The Stochastic Oscillator indicator compares where a security’s price closed relative to its price range over a given time period.