Join our fan page
- Views:
- 48335
- Rating:
- Published:
- Updated:
-
Need a robot or indicator based on this code? Order it on Freelance Go to Freelance
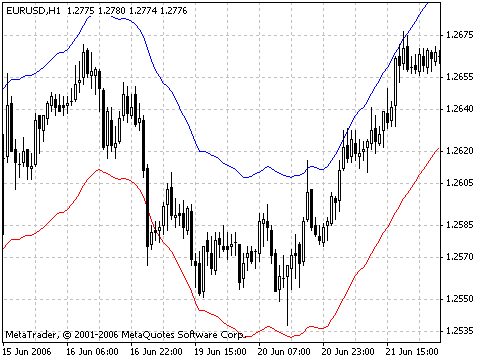
Envelopes technical indicator is formed with two Moving Averages one of which is shifted upward and another one is shifted downward.
The selection of optimum relative number of band margins shifting is determined with the market volatility: the higher the latter is, the stronger the shift is.
Envelopes define the upper and the lower margins of the price range. Signal to sell appears when the price reaches the upper margin of the band; signal to buy appears when the price reaches the lower margin.
The logic behind envelopes is that overzealous buyers and sellers push the price to the extremes (i.e., the upper and lower bands), at which point the prices often stabilize by moving to more realistic levels. This is similar to the interpretation of Bollinger Bands.
Calculation
Upper Band = SMA(CLOSE, N)*[1+K/1000]
Lower Band = SMA(CLOSE, N)*[1-K/1000]
where:
- SMA — Simple Moving Average;
- N — averaging period;
- K/1000 — the value of shifting from the average (measured in basis points).

Full description of Envelopes is available in the Technical analysis: Envelopes
Translated from Russian by MetaQuotes Ltd.
Original code: https://www.mql5.com/ru/code/7975
 DeMarker
Demarker indicator is based on the comparison of the period maximum with the previous period maximum.
 Average Directional Movement Index, ADX
Average Directional Movement Index Indicator (ADX) helps to determine if there is a price trend.
 Fractals
Fractals indicator it is a series of at least five successive bars, with the highest HIGH in the middle, and two lower HIGHs on both sides.
 Gator Oscillator, Gator
Gator Oscillator is based on the Alligator and shows the degree of convergence/divergence of the bal