
Testing of Expert Advisors in the MetaTrader 4 Client Terminal: An Outward Glance

To perform a test, you have to open the "Tester" window if it has not opened yet. This can be done in several ways: go to "View-Strategy Tester" in the main menu, press Ctrl+R, click on the "Strategy Tester" in the toolbar, use the context menu of the chart, to which the expert is attached ("Expert Advisors-Strategy Tester"), or press F6.
Before testing, an Expert Advisor must be selected. It can be selected from a popup menu or dragged using mouse from the "Navigator" window and dropped in the "Tester" window. The symbol can be selected in the same way: selected in the popup menu or dragged from the "Market Watch" window. Pressing F6 allows simultaneous selection of the expert, symbol, and the active chart period, but the expert must be attached to the active chart for this.
It is also necessary to select a method of historical data modelling. Some trading strategies do not depend on the price movements within the bar, they trade on bars already formed. The appearance of a new bar testifies that the current bar has been completely formed. It is for such experts that the modelling mode named "Open prices only" is intended for. It should be noted that, if data from the current bar are used to make trade decisions in the expert, testing of such expert in the "Open prices only" mode will be inadequate! As a rule, experts that work on bar completion have the following code to check whether the next bar starts:
static datetime prevtime=0;
...
if(prevtime == Time[0]) return(0);
prevtime = Time[0];
In all other cases, the "Every tick" model must beused. It is not recommended to use the "Control points" model for testing. This model is intended for crude estimate of the expert working in the optimization mode. After genetic algorithms of optimization have been added to the strategy tester, the necessity to use the "Control points" model is not longer relevant. For every-tick modeling of historical data to be adequate, it is necessary to have as many as possible one-minute data available. If there are no one-minute data available, the five-minute data are used for modelling. If they are not available either, the fifteen-minute data are used, etc. Respectively, the modelling quality will decrease.
When the "Start" button is clicked on, there will be first generated the test sequence for changing the price that will be cached in the file with FXT extension. All FXT files are stored in the <client_terminal_dir>\tester\history directory and have type name SSSSSSPP_M.fxt where:
- SSSSSS - is the symbol under test;
- PP - the value of the tested symbol period in minutes;
- M - testing model (0 - "Every tick", 1 - "Control points", 2 - "Open prices only").
In FXT-file header, the current settings of the symbol and of the current account
are written. The client terminal receives these settings automatically from the
trade server. Thus, the real server functioning will be simulated at testing: calculations
of margin calls, rollovers, commissions, taxes, etc. If there is no connection
at the moment, the latest known settings will be used for the trade server, to
which the client terminal was last connected. An FXT file is formed anew every
time when the Start button is pressed. The question now arises: Why to use this
file if it is created anew every time? First, there can be so many tick data that
they just cannot fit in the computer RAM, so an external storage is needed to take
the data from in chunks, which is especially important for optimization purposes.
Second, we can check what kind of sequence the tester has generated. The file can
be opened independently in order to see how price bars development is modeled.
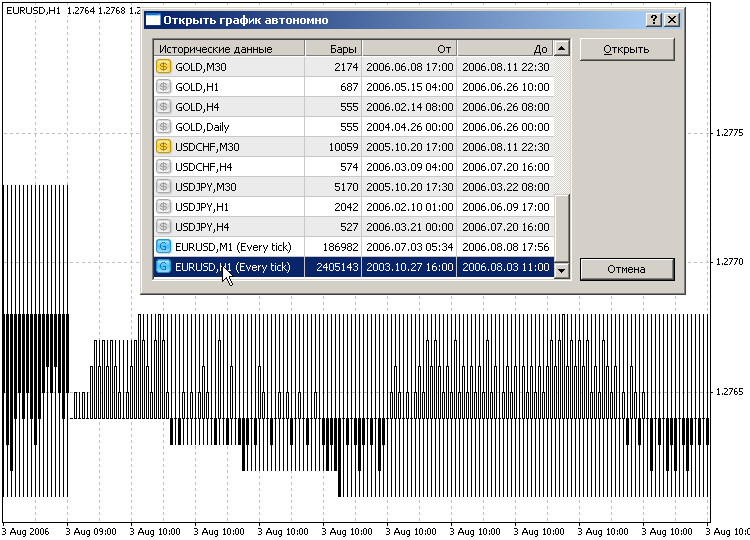
So, why to recalculate data already existing?
- First, data can get out of date by a couple of days, though there is a necessity to test on the latest historical data.
- Second, it happens very often at initial generation of every-tick data that not all the data of smaller timeframes can have been downloaded from the server by the moment of test sequence generation. The matter is that the data pumping is asynchronous since the server does not notify the client about the fact that all requested data have been transmitted. But we can be sure that all requested data are received within 1 or 2 minutes.
- Third, and this is the most important point, one user can have accounts with different brokers. And different brokers provide not only different trade conditions (please be reminded that the FXT-file header contains very important information to simulate the trade server work), but also historical data volume and quality. In this case, after switching to another account at testing, it is highly recommended to recalculate data.
- Fourth, it happens very often that there are misaligned data of different timeframes
from different sources available in the client terminal. The problem became very
acute after the client terminal had been provided with the function of downloading
large amounts of history for the basic currency pairs. Many traders working with
real brokers downloaded data from the MetaQuotes server. This is a very important
point influencing the modeling quality. To draw attention to this problem, the
tester considers errors of data misaligning for different timeframes. What kind
of errors are these?
It must be explained how a test sequence is formed if dates "from" and "to" are used (the corresponding box of "Use date" must be checked). A test sequence does not start from the "from" date. Before to start tick generating, the tester places about 4 thousand of ready non-modeling bars at the beginning of the sequence. If the are fewer initial bars, all bars from the beginning of history are used, but not fewer than 100. Thus, if the "from" date is placed too close to the beginning of the entire history, the tick generation may start after the specified date. We have to provide at least 100 bars before the test starts. The initial bars in the sequence are necessary for the Expert Advisor to be able to count indicators based on preceding data correctly (this especially concerns moving averages). Below is an example of a generated sequence of bar evolution on modeled ticks with initial date set to 2002.08.01:
Modeling is finished when the "to" date is reached. Price data starting from 0:00 of the end date do not participate in testing nor come into the generated sequence. If data specified are out of the range of history or "Use date" us disabled, all history (but the first 100 bars) will be involved in generation. The setting of maximal amount of bars in the chart does not mean anything for modeling - all history stored on the disk is used.
If it turns during test sequence forming that there are less historical data than 100 bars, there will a message of "TestGenerator: deficient data" appear in the tester journal and the tester will not be launched. It is also possible that there are no data at all, which happens if the date range is specified incorrectly, the message of "TestGenerator: no history data" will appear in the tester journal. In such cases, there must bethe necessary amount of historical data provided. To provide them, one can open the corresponding chart and pump data manually, using the PageUp button, and then enable "Recalculate" and restart tester.Before starting the tester, it is necessary to specify the inouts of the expert
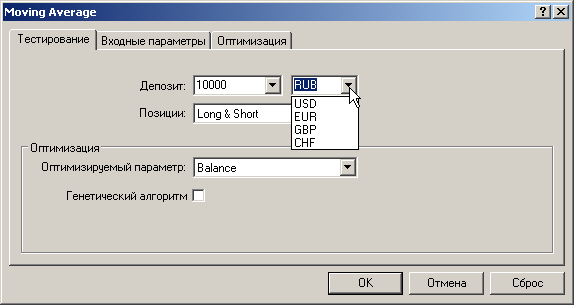
to be tested. A special attention must be paid to the deposit currency. For example,
if an account of the micex type is opened, the testing of the expert on GAZP will
not yield any results if not RUB (this symbol can be entered manually in spite
of the fact that it is not in the popup list) is specified as the deposit currency:
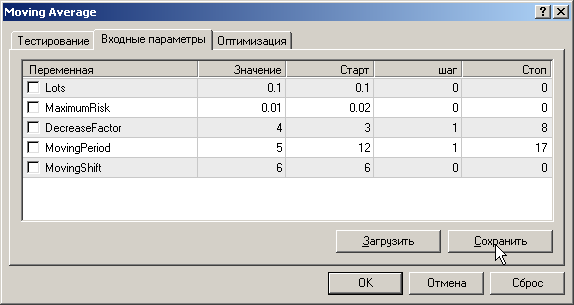
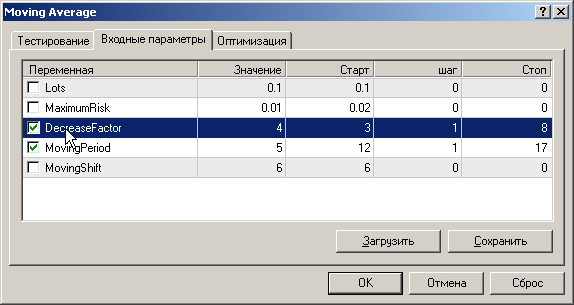
The "Inputs" tab will be visible only if external variables are declared. Different sets of input values can be saved in set files under different
names ("Save" button) and used in future ("Load" button).
Clicking on the "Modify Expert Advisor" button will call MetaEditor, in
which the expert under test will be opened for editing. This button, like others,
is blocked at tester start. However, MetaEditor will still allow to recompile the
expert, if even the expert is being tested. When starting the tester next time,
the recompiled Expert Advisor will be reloaded for testing automatically.
It is well to bear in mind that, while the expert is being tested, it cannot be reloaded. Suppose, you did not waste your time and changed the expert's source code and recompiled it during the testing. The test is complete and you click on the "Start" button again with the hope to test the modified expert advisor. But no, the previously downloaded executable file will be tested again. To reload the new version of the expert, you have to click on the "Stop" button or wait until the test is complete. And only after that, start to recompile your expert advisor in MetaEditor.
After the testing is complete, you can open the chart with arrows of trade operations shown in it and indicators used during the test. However, there is a problem with that indicators used during the test will be displayed in default colors. For example, if moving averages with different averaging periods were used, they all will be drawn in red, which is not very convenient, of course. The colors can be changed manuall, but there is another solving of the problem. If a template named like <expert_name>.tpl (for example, Moving Average.tpl) with attached indicators is created in aвvance, this template will be used when the chart to be tested is opened. If no templates are available, the tester.tpl template will apply.
There is another finer point here. If the test graph is opened in the above way,
the current historical data will be loaded in it. If the test sequence has just
been obtained, there is no problem. And if the data used came from another data
feed? Fortunately, starting with the MetaTrader 4 Client Terminal Build 196, the
strategy tester supports the so-called strategy testing visualization.
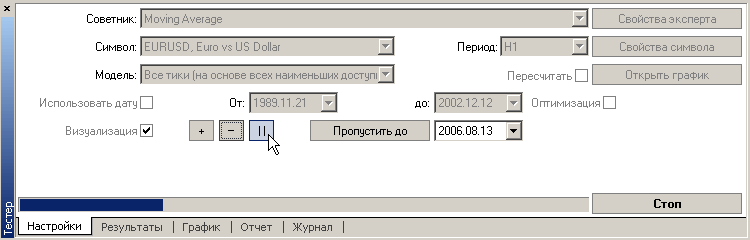
If the "Visualization" is checked, a "debugging" chart will open automatically at the server startup using the templates of <expert_name>.tpl or tester.tpl. The current state of the test sequence is displayed in the graph. The changing of visualization rate is achieved through using of the slider. If it is moved to the left, the rate will be slower. Right move will, correspondingly, make it faster. To make a pause, one can press either "||" button or Pause key on the keyboard. To continue testing after the pause, it is necessary to press ">>" or, again, Pause. When the testing is paused, one can press F12 to provide step-by-step manual visualization. The displaying can be enhanced using the "+" button, slowed down with the "-", paused with the "||", and resumed after the pause with the ">>". One can specify the date and click on the "Skip to". In this case, the graph will not be redrawn until the tester reaches the specified date, which essentially accelerates the process. After the testing is over (either complete or via stopped by clicking on the "Stop"), нthe historical data state at the stop will be displayed on the graph.
At viewing of the test graph, the double click on a section of it provides switching to the Results tab and selection of the corresponding position. If the test graph was opened ("Visualization" checked or "Open graph" clicked), the double click on a position in the "Results" tab will move the graph to the corresponding date.
To optimize a trading strategy, one has to take at least 2 steps. Check "Optimization"
in the "Settings" tab and set up initial and final values and the change
increment value for optimized parameters in the expert's properties in the "Inputs"
tab.
Thus, if an expert does not have any inputs, it cannot be optimized. The optimization
process can be enhanced by setting up optimization limits.
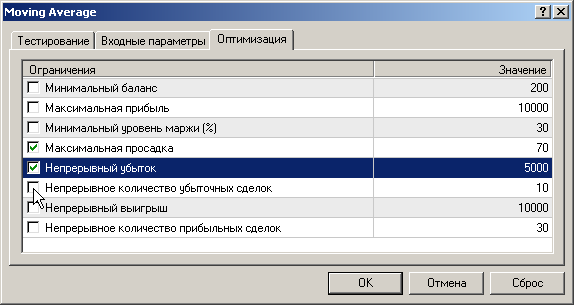
As soon as the corresponding limit is reached, the tester stops the pass and starts a new one, with the next inputs set. At this, the pass terminated because of the limit is considered as unsuccessful and will not be listed among results. Passes with negative profits are considered unsuccessful. as well. To include the unsuccessful passes into the list of optimization results, it is necessary to uncheck the "Skip useless results" in the context menu of the "Optimization Results" tab.
It is a very frequent reason for claims like "strategy optimizer does not work" that, by default, the unsuccessful results are not listed. In this case, the message "NNN results have been discarded as insignificant" will appear in the journal.
To enhance optimization process, the caching of results was implemented. If, at the repeated optimization pass, the tester has found in cache the result that corresponds with the current inputs set, the found result will be used without expert execution. Thus, the optimization can be stopped since the next launch of the epxert optimization with the same inputs will allow to receive from cache the previously calculated results and continue calculations from the interrupted pass of the tester. If the test data have been changed or the expert has been recompiled, or libraries used by the expert have been replaced, optimizer cache will be reset and all calculations made again.
The tester cannot control changes in libraries of Level 2 or higher (i.e., libraries
called from other libraries)! This is why, in such cases, it is necessary to reset cache manually, for example,
by recompiling the expert. The files containing cached data are stored in the tester\caches
directory.
Caching of optimization results helps, as well, when enabling genetic algorithm. The genetic algorithm of optimization can be enabled in the expert's properties
in the "Testing" tab.
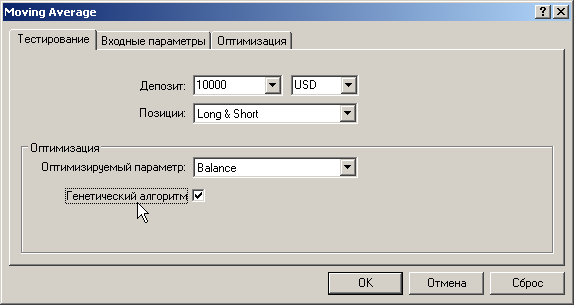
Parameters of the genetic algorithm are defined automatically.
- The population size depends on the amount of all possible combinations of parameters and can take values from 64 to 256.
- The minimal amount of generations depends on the population size and can take values from 15 to 31.
- Thus, the minimal amount of genetic optimizer passes lies within the range of 960 to 7936.
- The crossover probability is equal to 100%. Genes are crossed over randomly, an individual being unable to cross over with itself.
- The mutation probability is equal to 10%.
- The inversion probability is equal to 10%.
- Genetic optimization is terminated if the gene pool has not been improved within the life of 10 generations, provided that the minimal amount of generations has been formed.
The test Journal is located in the \logs directory. Its files have extension .log. A separate log file corresponds with each separate day. The Tester logs are deleted automatically within 5 days. If the "Clear All Journals" is selected from the context menu of the "Journal" tab, the current contents of this tab will deleted, all log files will be removed.
As the mass data output in journal is possible during testing, not the entire information can get to the "Journal" tab, but it will surely get into a log file. At optimization, no output in the journal is provided.
After testing is complete, the RAM unused by the tester anymore can be emptied. To do so, it is sufficient to close the "Tester" window using either the main menu or Ctrl-R, or clicking on the "Strategy Tester" in the toolbar.
Original article: /ru/articles/1417
Translated from Russian by MetaQuotes Ltd.
Original article: https://www.mql5.com/ru/articles/1417
Warning: All rights to these materials are reserved by MetaQuotes Ltd. Copying or reprinting of these materials in whole or in part is prohibited.
This article was written by a user of the site and reflects their personal views. MetaQuotes Ltd is not responsible for the accuracy of the information presented, nor for any consequences resulting from the use of the solutions, strategies or recommendations described.

 Secrets of the MetaTrader 4 Client Terminal: Indicators
 Secrets of MetaTrader 4 Client Terminal: Alerting System
 Multiple Null Bar Re-Count in Some Indicators
 Secrets of MetaTrader 4 Client Terminal
- Free trading apps
- Over 8,000 signals for copying
- Economic news for exploring financial markets
You agree to website policy and terms of use
Thank you very much for an awesome article. I am looking for ways to yield 99% accuracy in back testing. If my EA trades on the open of the 1hour candle, do I still need tick by tick data? I would imagine that the 1M should be reasonable.
Hi Slawa,
Thank you very much for an awesome article. I am looking for ways to yield 99% accuracy in back testing. If my EA trades on the open of the 1hour candle, do I still need tick by tick data? I would imagine that the 1M should be reasonable.