Nine Lives of CCI MT4
- Indikatoren
- Version: 3.8
- Aktualisiert: 23 Mai 2020
- Aktivierungen: 5

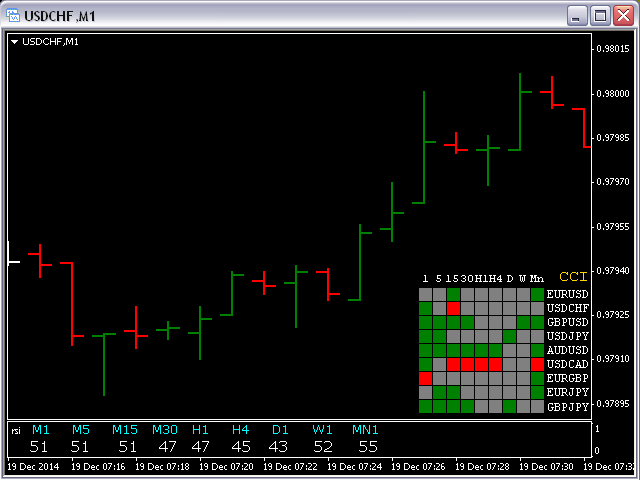
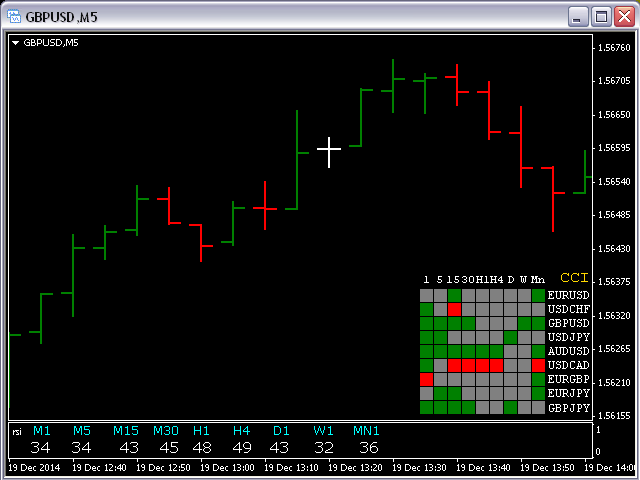
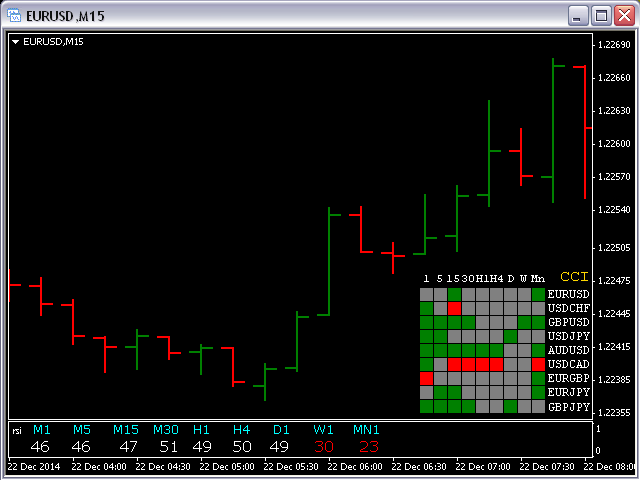
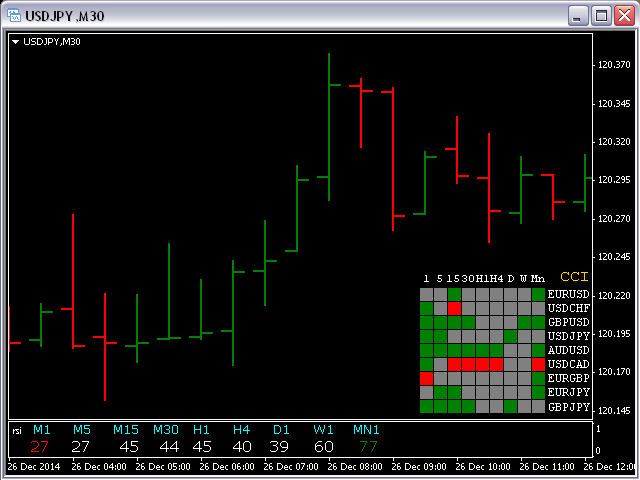
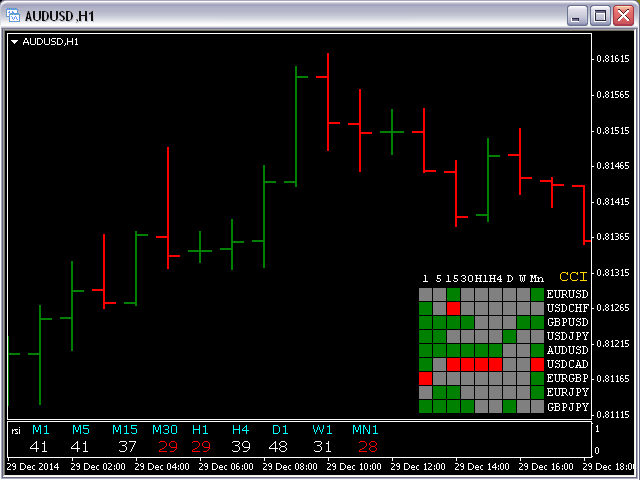
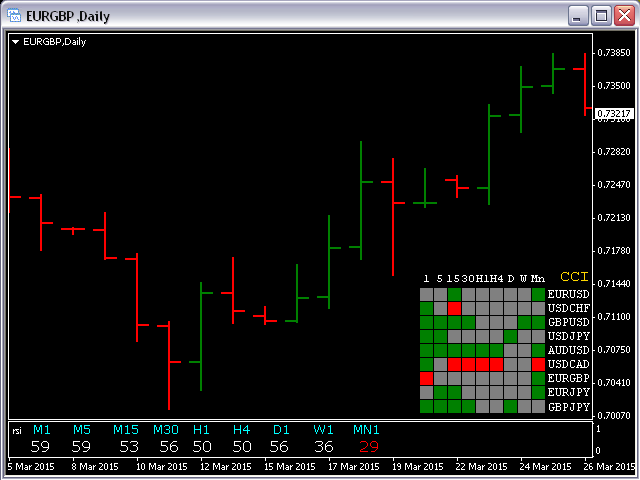
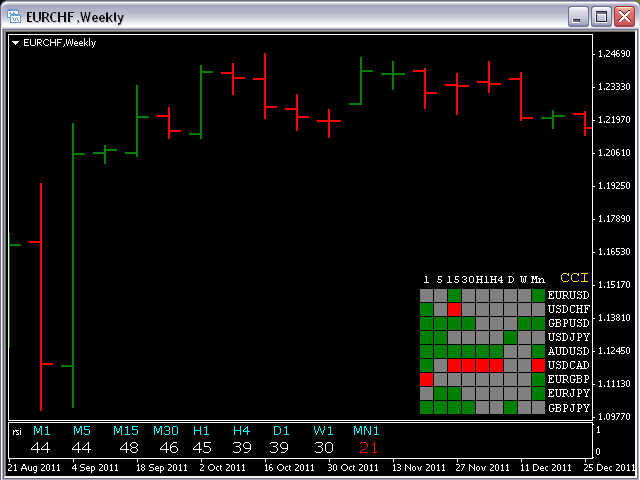
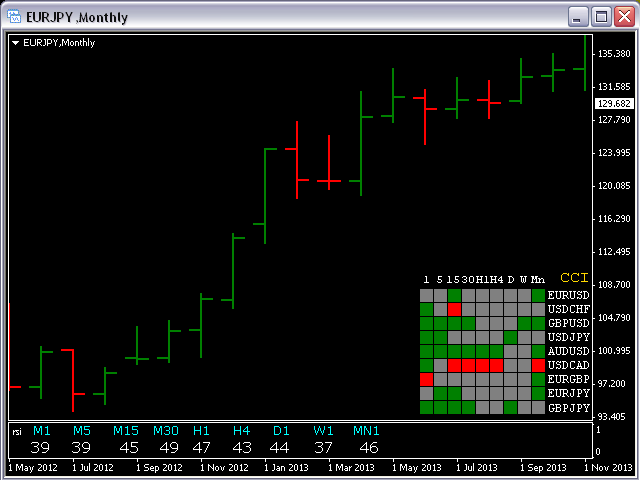
Dieser Indikator zeigt Commodity Channel Index (CCI) Daten von 9 Währungspaaren Ihrer Wahl für alle 9 Time Frames.
Wenn ein digitaler Wert des CCI kleiner oder gleich DnLevel = -100 (oder eine von Ihnen festgelegte Zahl) ist, wird ein grünes Quadrat angezeigt. Dies ist ein potenziell überverkaufter Zustand und vielleicht ein guter Zeitpunkt, um Long zu gehen .
Wenn ein digitaler Wert des CCI größer oder gleich UpLevel = 100 (oder eine beliebige Zahl, die Sie eingeben) ist, erscheint ein rotes Quadrat. Dies ist ein potenziell überkaufter Zustand und möglicherweise ein guter Zeitpunkt, um zu verkaufen.
Wenn ein digitaler Wert des CCI zwischen einem UpLevel und einem DnLevel liegt, erscheint ein graues Quadrat.
Eingabe-Parameter
- Von Symb1 bis Symb9 - Sie können jedes dieser Symbole in ein beliebiges legales Währungspaar ändern, das auf Ihrer Plattform existiert.
- cPeriod = 14; - Mittelungszeitraum für den CCI.
- appPrice = PRICE_CLOSE; - angewandter Preis für den CCI.
- UpLevel = 100; - überkauftes Niveau.
- DnLevel = -100; - überverkauftes Niveau.
- SymbColor = clrWhite; - Sie können die Farbe aller Beschriftungen ändern.