MACD Divergence Finder
- Indikatoren
- Version: 1.2
- Aktivierungen: 5

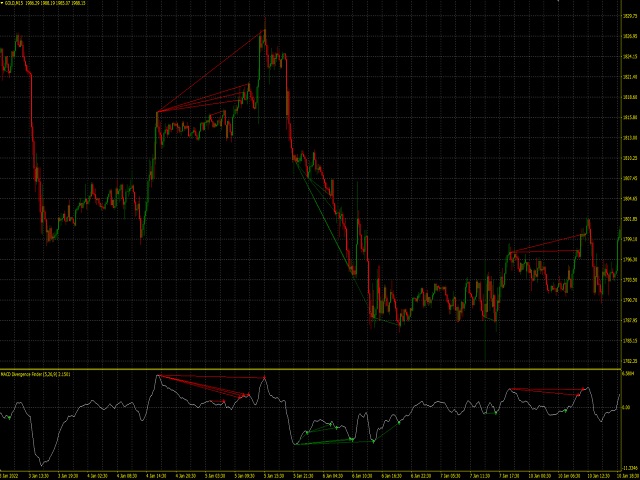
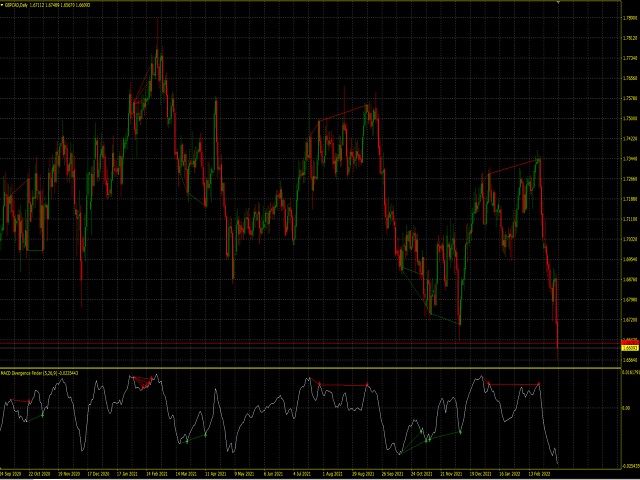
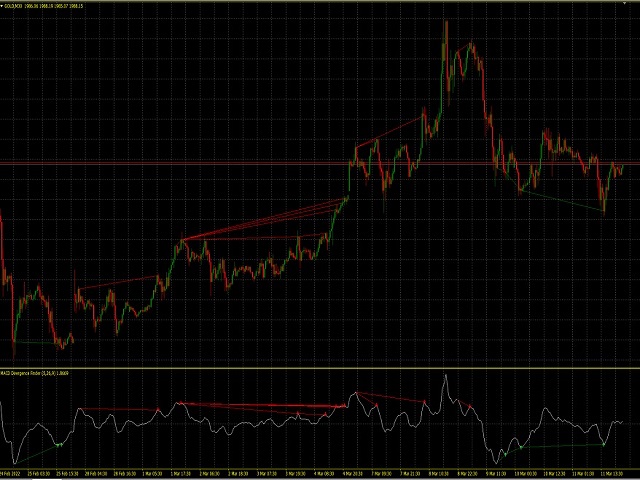
Der MACD Divergence Finder Indikator hilft Ihnen, Abweichungen zwischen Ihren typischen MACD-Werten und den Chartpreisen als potenzielle Punkte einer Trendumkehr oder eines Pull Backs zu erkennen, um Ihre Positionen entsprechend dem aktuellen Trend zu erhöhen.
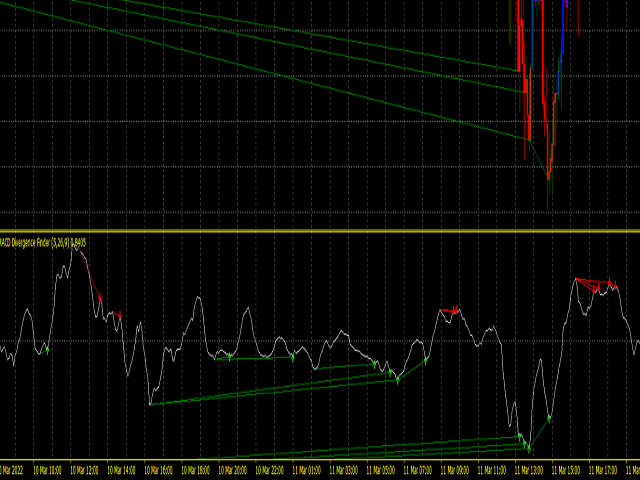
Indicator Windows zeichnet MACD-Werte und Divergenzpfeile, aber kein MACD-Signal, da es nicht als relevant angesehen wird, diese Art von klassischen Divergenzen zu erkennen.
Auf einigen Computern/VPS mit alten Mikroprozessoren oder geringer RAM-Größe kann es beim Starten des Indikators (Anhängen, Ändern der Einstellungen, Zurücksetzen oder sogar Ändern des Zeitrahmens), da er den Chart analysiert, um zu vermeiden, dass das, was sich nicht ändert, aktualisiert wird, zu einer leichten Verzögerung beim Start kommen, die auf die Anzahl der ausgewählten Bars und die Einstellungsbedingungen für die Analyse zurückzuführen ist (im Indikator anpassbar). Verwenden Sie die Einstellungswerte auf intelligente Art und Weise und basierend auf Ihren tatsächlichen Bedürfnissen, da das mehrmalige Hinzufügen von Bars zur Analyse Ihnen keine Änderungen des letzten Ergebnisses bringen wird.
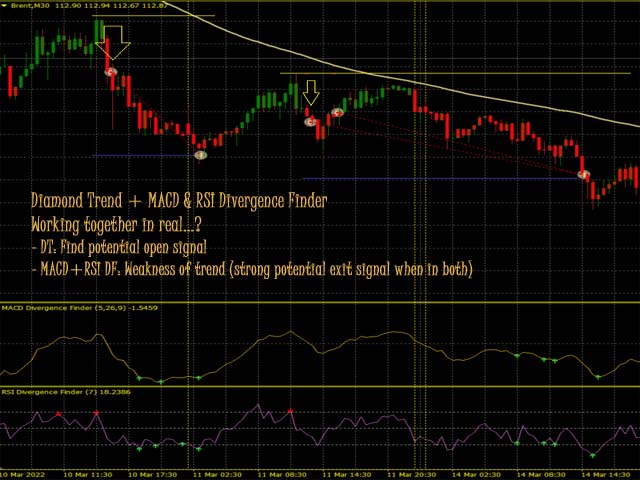
Wie ich immer empfehle, treffen Sie keine endgültige offene Entscheidung ohne einen Unterstützungsindikator, der sie bestätigt.
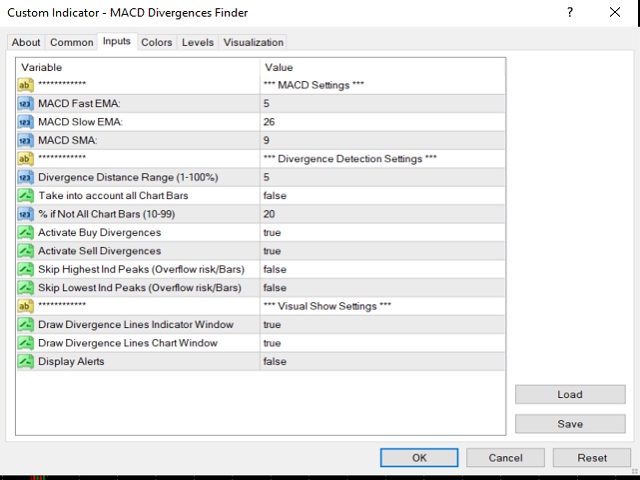
Der MACD Divergence Finder kann an Ihre Bedürfnisse angepasst werden und funktioniert mit den unten aufgeführten Einstellungen:
- MACD Fast EMA: Wert des MACD Fast EMA
- MACD Slow EMA: Wert des MACD Slow EMA
- MACD SMA: Wert des MACD SMA
- Divergence Distance Range (1-100%): Geben Sie den Suchbereich für die Erkennung von Divergenzen an. Ein größerer Bereich bedeutet eine größere Anzahl von Divergenzen, die erkannt werden können, aber auch weniger relevant, wenn diese nicht näher an Ihrer aktuellen Zeitlinie liegen... Denken Sie daran, dass ein längerer Bereich auch bedeutet, dass der Indikator mehr Zeit benötigt, um die erste Analyse abzuschließen.
- Berücksichtigen Sie alle Chart-Balken: Wenn Sie möchten, dass der MACD Divergence Finder alle verfügbaren Chart-Balken analysiert, denken Sie daran, dass die Analyse aller verfügbaren Balken auch dazu führen kann, dass der Indikator mehr Zeit benötigt , um die anfängliche Analyse zu vervollständigen, es sei denn, Sie möchten ein sehr altes Signal analysieren.
-% wenn nicht alle Balken (10-99%): Nur wenn Sie die letzte Option auf "false" gesetzt haben , können Sie den Prozentsatz aller verfügbaren Balken angeben, die der MACD Divergence Finder analysieren soll. Denken Sie daran, dass die Analyse aller verfügbaren Balken auch dazu führen kann, dass der Indikator mehr Zeit benötigt, um die erste Analyse zu vervollständigen, es sei denn, Sie möchten ein sehr altes Signal analysieren.
- Kaufdivergenzen aktivieren: Möchten Sie, dass der MACD Divergence Finder bullische Divergenzen erkennt?
- Verkaufsdivergenzen aktivieren: Möchten Sie, dass der MACD Divergence Finder bärische Verkaufsdivergenzen erkennt?
- Höchste Indikatorspitzen überspringen: Selten gibt es sehr hohe Spitzen, die sich auf die Stärke der Divergenz auswirken können. Aktivieren Sie diese Funktion, wenn Sie diese berücksichtigen und vermeiden möchten (und Sie nicht alle verfügbaren Chart-Balken analysieren möchten, da diese Funktion die anfängliche Zeit des MACD Divergence Finders erhöht und den Metatrader 4 während der Analyse in den Status "Keine Antwort" versetzen kann).
- Skip Lowest Indicator Peaks: Selten gibt es sehr niedrige Peaks, die sich auf die Stärke der Divergenz auswirken können. Aktivieren Sie diese Funktion, wenn Sie diese berücksichtigen und vermeiden möchten (und Sie nicht alle verfügbaren Chart-Balken analysieren möchten, da diese Funktion die anfängliche Zeit des MACD Divergence Finders erhöht und den Metatrader 4 während der Analyse im Status "Keine Antwort" belassen kann).
- Divergenzlinien Indikator-Fenster zeichnen: Erlaubt dem MACD Divergence Finder, Divergenzlinien in das Indikator-Fenster zu zeichnen, was sehr nützlich ist, um die Quelle der Divergenzen anhand der Chart-Werte zu bewerten.
- Divergenzlinien im Chart-Fenster zeichnen: Erlaubt dem MACD Divergence Finder, Divergenzlinien in das Chart-Fenster zu zeichnen, was sehr nützlich ist, um den Preisbalken zu bewerten, bei dem die Divergenz im Vergleich zum Indikator entstanden ist.
- Display Alerts: Aktivieren Sie diese Option , wenn Sie eine Popup-Meldung über eine neu entdeckte Divergenz erhalten möchten.
Ausgabe der vom MACD DIvergence Finder gelieferten Werte in das Datenfenster (wenn Sie diese in Ihrem eigenen EA verwenden möchten):
MACD-Wert: MACD-Wert
Bullish Signal: Es wird ein Wert an der Position angezeigt, an der die Bullish Divergence erkannt wurde
Bearish Signal: Es wird ein Wert an der Position angezeigt, an der die Bearish Divergence erkannt wurde.