Multi Pivot Unlimited
- Indikatoren
- Version: 2.0
- Aktualisiert: 16 April 2021
- Aktivierungen: 5

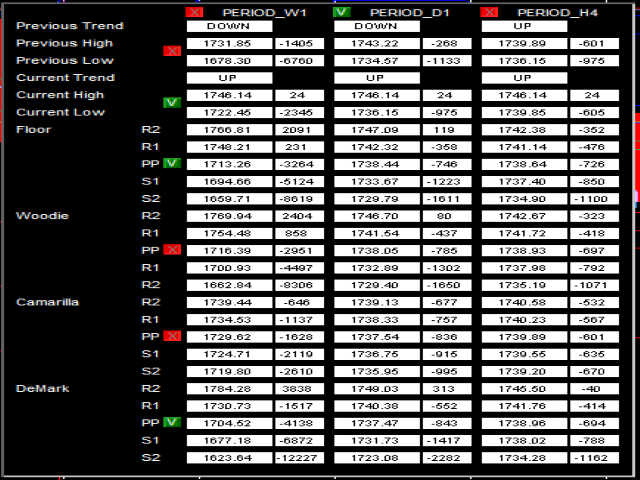
Fünf Typen (Floor, Woodie, Camarilla, DeMark, & Fibonacci) von beliebtenPivot Points zur Bestimmung von Widerstands- und Unterstützungsniveaus .
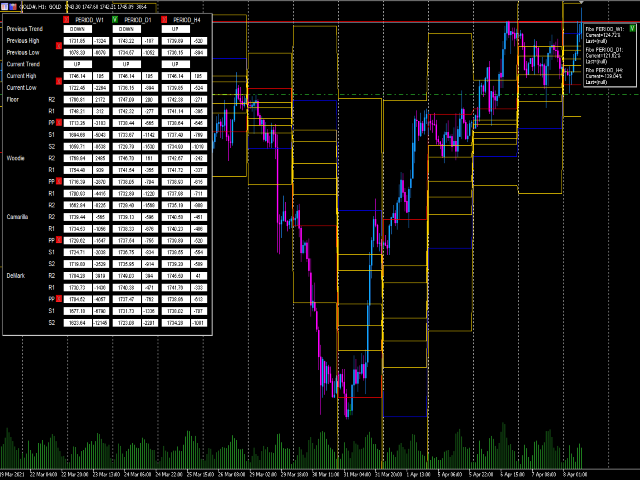
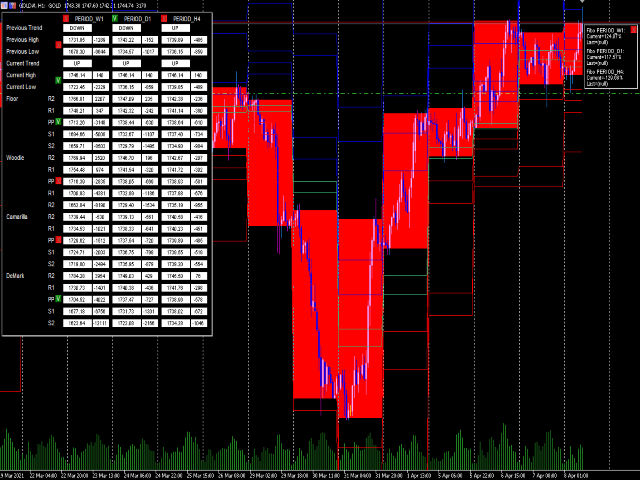
Mit einer einfachen Schaltfläche auf dem Diagramm können Sie einige oder alle Arten vonPivot-Punkten,Widerstands- und Unterstützungsniveaus anzeigen, wie Sie möchten.
Sie können es füralle Währungspaare,Kryptowährungen undAktien ohne Einschränkungen verwenden.
Signallinie, um das Lesen des Hoch-Tief-Schlusskursmusters zu erleichtern. (Ich verwende normalerweise 15M Zeitrahmen für den Chart und 1Tag für den Indikator)
Erhalten Sie eineBenachrichtigung, wenn der Preis die Linienach oben oder unten überschreitet.
Dies ist die kostenlose Version: https://www.mql5.com/en/market/product/65132
Um mit ausgewählten Timeframes zu arbeiten, aktualisieren Sie bitte zuerst die Historie der Timeframes, indem Sie die Perioden (M5, M15, M30, H1, etc.) auswählen. (Es wird ein zukünftiges Update dafür geben, so dass die Historie automatisch aktualisiert werden kann)
Wenn es noch andere Probleme gibt, können Sie mir einfach eine Nachricht schicken.
Chart Dienstprogramm:
- Schaltflächen zur Anzeige der Pivot-Linie im Chart (es können mehrere Pivot-Linien angezeigt werden)
- Schaltflächen zur Auswahl des Zeitrahmens für die Pivot-Linie im Chart
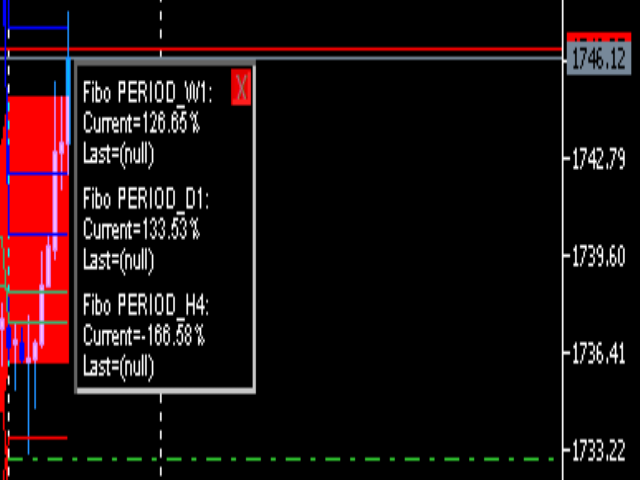
- Fibonacci-Mini-Panel zur Anzeige von Details der aktuellen Prozentposition
- Preis jedes Pivots und jedes Timeframes (Sie können den Wert einfach kopieren und einfügen, um eine Order auszuführen )
- Gap-Punkte des Pivot-Kurses und des aktuellen Kurses (Sie können den Wert einfach kopieren und einfügen, um einen Auftrag zu erteilen)
Eingaben:
- Periode 1 Zeitrahmen
- Periode 2 Zeitrahmen
- Zeitraum 3 Timeframes
- Fibonacci More100, Before100, BeforeBefore100, Middle, AfterAfterZero, AfterZero, und LessZero Level Prozentsatz
- Alert (Alarmbenachrichtigung einschalten)
- E-Mail (E-Mail-Benachrichtigung aktivieren)
- MetaQuotes (Aktivieren Sie die MetaQuotes-Benachrichtigung, Sie können eine Benachrichtigung von Ihrem mobilen Gerät erhalten)
- Period 1, Period 2 und Period 3 Benachrichtigung aktivieren
- Floor-, Woodie-, Camarilla-, DeMark- und Fibonacci-Benachrichtigung aktivieren
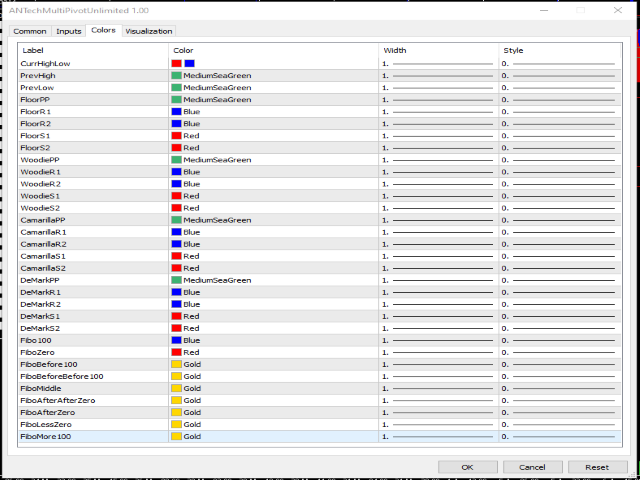
- Farblinie und Typ für jeden Pivot