Trend dashboard MT5
- Indikatoren
-
Jan Flodin
 Hello, my name is Jan and I have been developing automated trading tools for the last 9 years. I am originally from Sweden but have lived in the Czech Republic since 2003.
PRODUCTS - Version: 2.6
- Aktualisiert: 16 November 2023
- Aktivierungen: 10
Ich empfehle Ihnen,den Blog des Produkts (Handbuch) von Anfang bis Endezu lesen, damit von Anfang an klar ist, was der Indikator bietet.
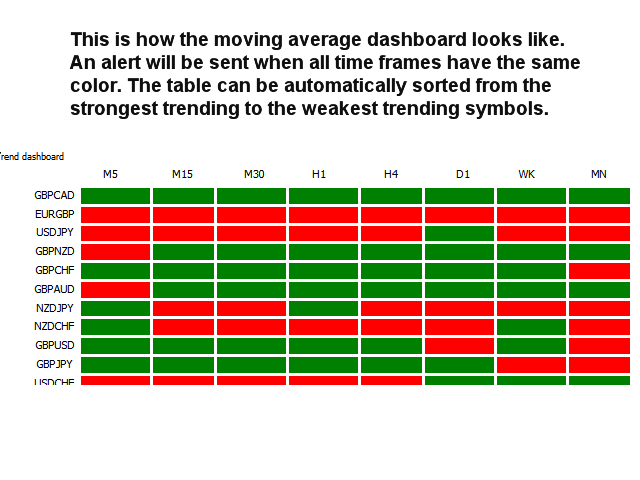
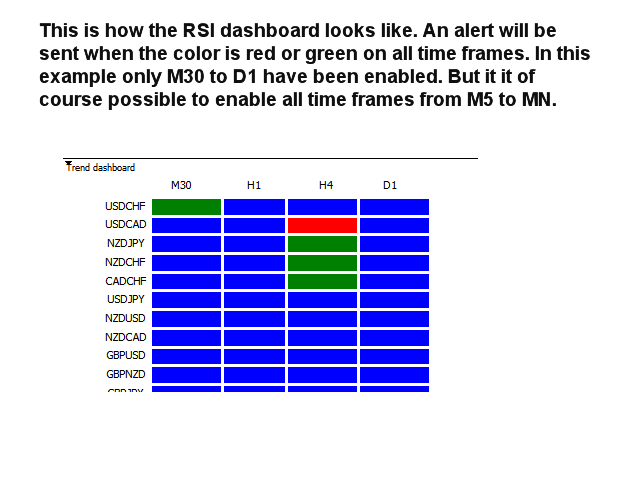
Dieser Trendindikator mit mehreren Zeitrahmen und Symbolen sendet einen Alarm, wenn ein starker Trend oder eine Trendumkehr erkannt wurde. Er kann dies tun, indem er das Dashboard unter Verwendung von gleitendem Durchschnitt (einfach oder doppelt (beide MA:s ausgerichtet und Preis über/unter beiden)), RSI, Bollinger Bändern, ADX, Composite Index (Constance M. Brown), Awesome (Bill Williams), MACD (Signallinie), Heiken Ashi geglättet, Hull gleitender Durchschnitt, Stochastik-Crossovers, Gann HiLo Activator und Traders Dynamic Index aufbaut. Es kann mit allen Zeitrahmen von M1 bis MN verwendet werden. Es können maximal 9 Zeitrahmen gleichzeitig im Dashboard angezeigt werden. Die Farben im Dashboard sind grün für bullish, rot für bearish und blau für neutral (Indikatorwerte nicht im Bereich).
Kombiniert mit Ihren eigenen Regeln und Techniken können Sie mit diesem Indikator Ihr eigenes leistungsstarkes System erstellen (oder erweitern).Merkmale
- Der Indikator kann die Signale in globale Variablen schreiben, die von einem Expert Advisor für den automatischen Handel verwendet werden können.
- Es ist möglich, bis zu 9 Zeitrahmen für die Verwendung auszuwählen.
- Führt fortlaufend eine Sortierung nach Trendstärke im Dashboard durch.
- Durch Klicken in ein Rechteck wird ein neuer Chart mit dem entsprechenden Symbol und Zeitrahmen geöffnet.
Es genügt, den Indikator auf einem Chart zu platzieren, und Sie erhalten einen Alarm von einem beliebigen Symbol Ihrer Wahl. Alle Alarmtypen werden unterstützt.
Eingabe-Parameter
Die Beschreibung und Erklärung der Eingabeparameter finden Sie hier.
Wichtig
Bitte beachten Sie, dass dieser Indikator im Strategietester nicht unterstützt wird. Er zeichnet auch keine Linien und Pfeile oder Verkaufs- und Kaufempfehlungen auf einem Chart.
Der Indikator muss auf einem M5-Chart platziert werden. Ein sauberer (leerer) Chart ohne andere Indikatoren oder Expert Advisors, die das Dashboard beeinträchtigen könnten. Das Dashboard wird in ein Indikatorfenster geladen, das Sie dann auf den gesamten Chart ausdehnen können.


very satisfied with this software exactly what i needed to improve my trading