Mega Super
- Indikatoren
- Version: 1.0
- Aktivierungen: 5

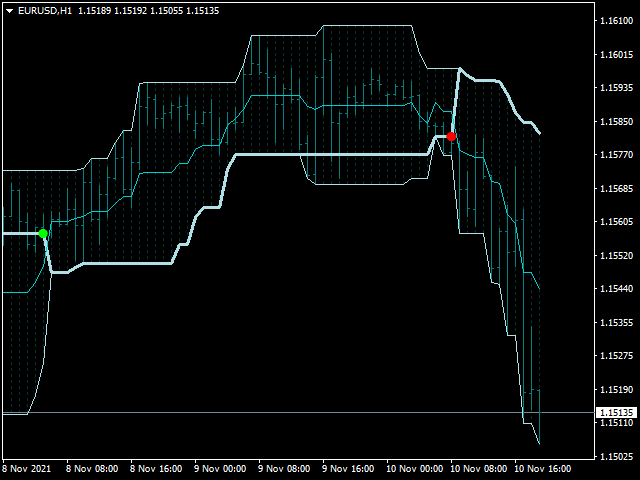
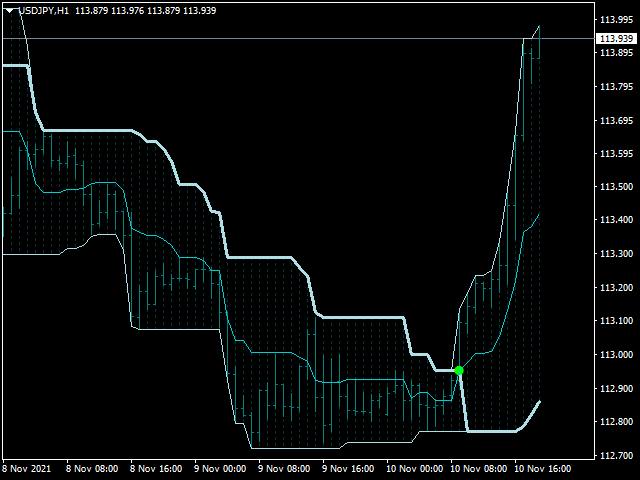
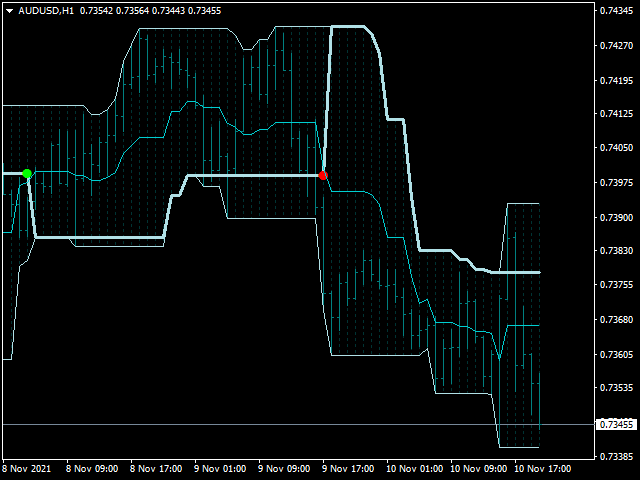
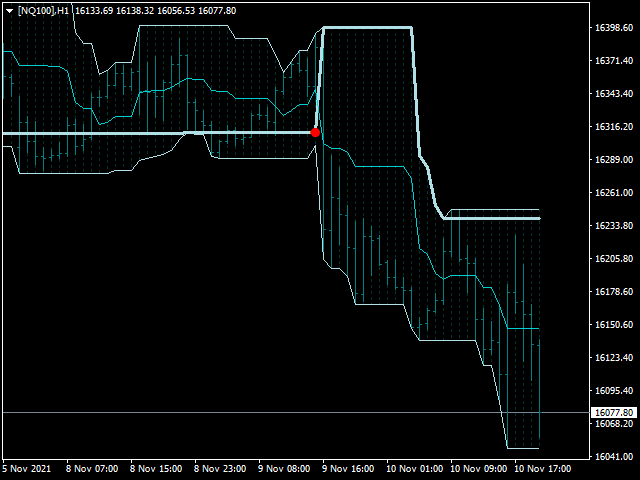
Dieser Indikator zeigt die Trendbewegungan , hilft beim Kauf und Verkauf undzeigt Pfeil und Linie an.
Eigenschaften
- pro - zeigt Indikator Zeitraum.
Wie ist der Status zu verstehen:
- Wenn die Pfeilfarbe grün ist, ist der Trend nach oben.
- Wenn die Pfeilfarbe rot ist, ist der Trend nach unten.
////////////////////////////////////////////////////////////////////////////////////////////////////////////////////////////////////////////////////
////////////////////////////////////////////////////////////////////////////////////////////////////////////////////////////////////////////////////// ////////////////////////////////////////////////////////////////////////////////////////////////////////////////////////////////////////////////////// ////////////////////////////////////////////////////////////////////////////////////////////////////////////////////////////////////////////////////// ////////////////////////////////////////////////////////////////////////////////////////////////////////////////////////////////////////////////////// ////////////////////////////////////////////////////////////////////////////////////////////////////////////////////////////////////////////////////// ////////////////////////////////////////////////////////////////////////////////////////////////////////////////////////