RTrends
- Indikatoren
- Version: 1.1
- Aktualisiert: 18 November 2021
- Aktivierungen: 5

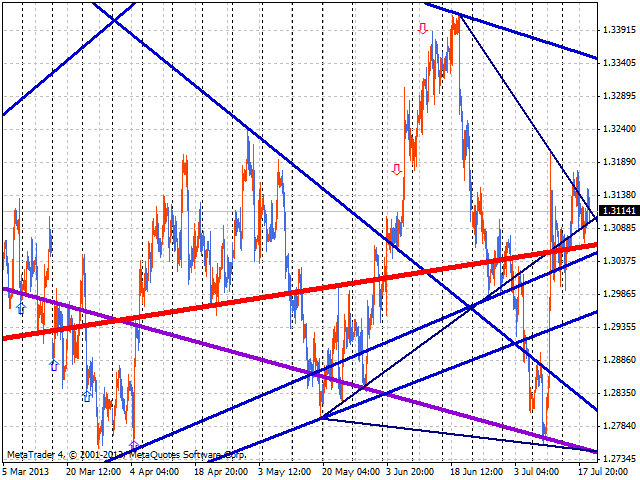
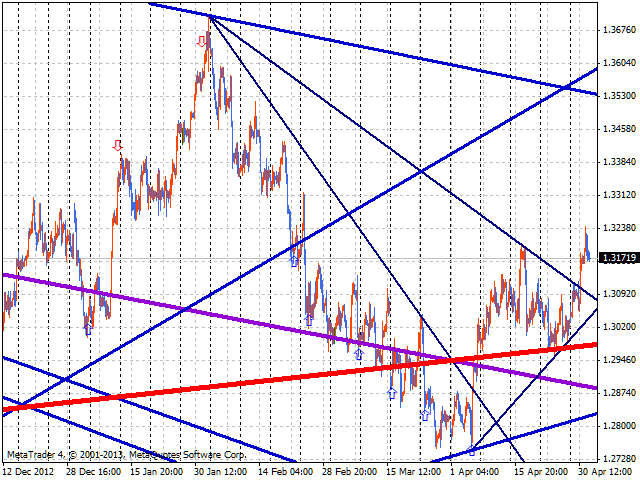
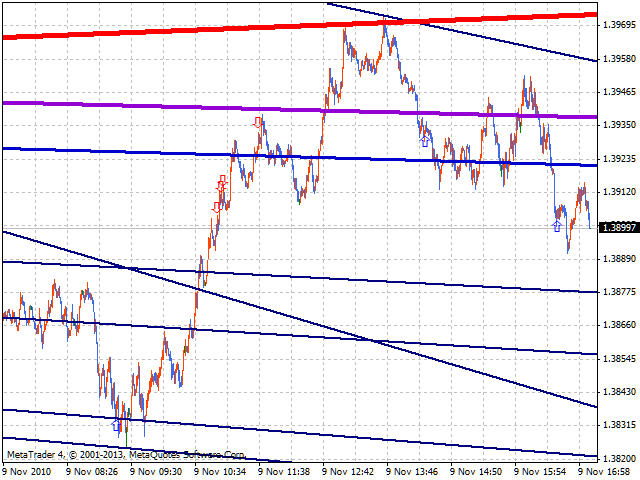
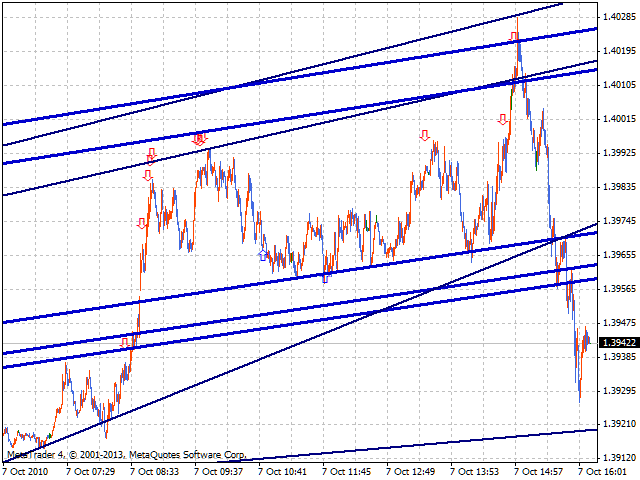
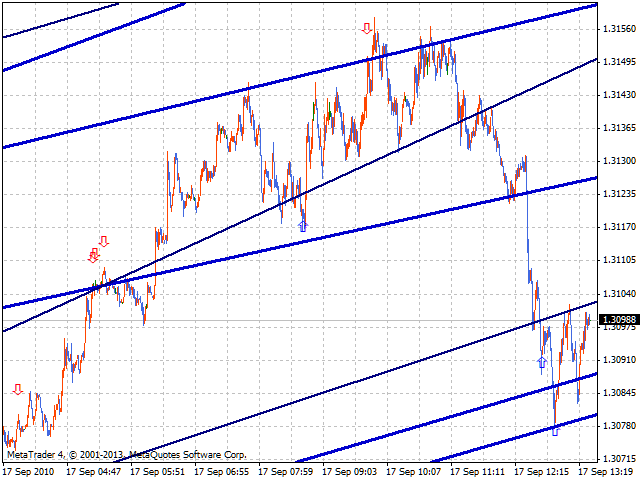
Der RTrends-Indikator erfüllt zwei Aufgaben: Erstens zeichnet er automatisch das Layout des Preisdiagramms, indem er Trendlinien einzeichnet, und zweitens erzeugt er Signale für steigende und fallende Kurse.
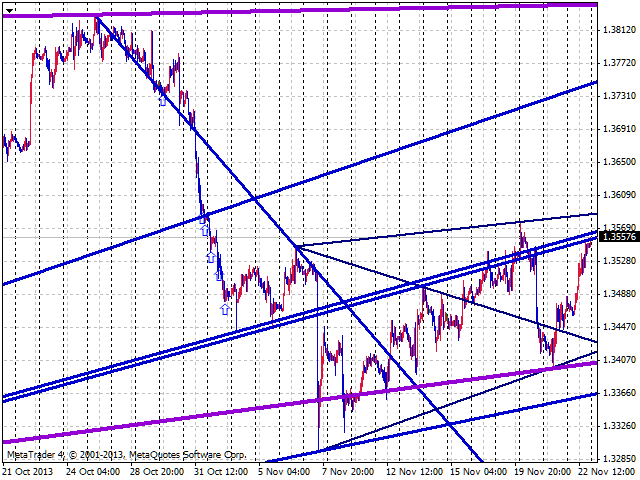
Das Layout spiegelt die fraktale Natur des Marktes wider. Trends aus verschiedenen Zeithorizonten werden gleichzeitig in das Diagramm eingezeichnet. So kann ein Händler in einem einzigen Diagramm Trendlinien von höheren Zeitrahmen sehen. Die Linien unterscheiden sich je nach Zeithorizont in Farbe und Breite: Je älter der Zeithorizont, desto dicker ist die Linie.
Um den Aufbau des Indikators zu vereinfachen, werden nur 4 Farben verwendet. Sie können in den Parametern des Indikators eingestellt werden. Drei kleinere angezeigte Horizonte haben individuelle Farben, der vierte und die folgenden haben die gleiche Farbe. Dies ist darauf zurückzuführen, dass die höheren Linien selten sind. Zum Beispiel markiert der Indikator auf einem Minutenchart für fast 14 Jahre nur etwa 10 Horizonte. Die Linienmarkierung (sichtbar, wenn Sie mit der Maus über die Linie fahren) enthält zusätzliche Informationen. Zum Beispiel bedeutet die Bezeichnung Sup7_1 eine Unterstützungslinie, die sich auf den Horizont mit der Nennnummer 7 bezieht und die Nummer 1 auf diesem Horizont hat (nummeriert von Null). In ähnlicher Weise bedeutet die Bezeichnung Res5_0 die Widerstandslinie Nummer 0 des Horizonts 5.
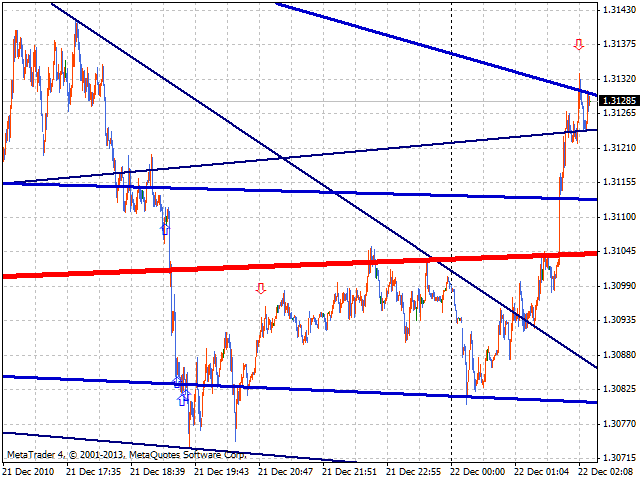
Die Signale der Indikatoren werden in "bullish" und "bearish" unterteilt; ihr Hauptvorteil besteht darin, dass die Signale sehr früh kommen. Die Kehrseite der Medaille ist die große Anzahl an "falschen" Signalen. Daher müssen sie zusätzlich gefiltert werden. Es ist daher besser, sie als Signale für einen Entscheidungszeitpunkt (Einstieg oder nicht) zu betrachten und nicht als direkte Signale für die Eröffnung einer Position. Ein Signal wird von einem Popup-Fenster mit zusätzlichen Informationen begleitet. Diese Momente sind als Pfeile auf dem Chart markiert. Sie können auch aus dem Indikatorpuffer abgelesen werden. Der Wert +1 entspricht einem bullischen Signal, -1 einem bärischen, 0 bedeutet kein Signal.
Der Indikator hat die folgenden Parameter:
- DrawFrom gibt die Nummer des Horizonts an, bei dem die Anzeige der Trends beginnt (d.h. die Nummer des kleineren Horizonts).
- SgnRank legt den Rang der Signale fest.
- ShowAlert ermöglicht die Aktivierung/Deaktivierung des Popup-Fensters.
- Color1 legt die Farbe der Linien des kleinsten angezeigten Horizonts fest.
- Color2 und Color3 legen die Farbe der Linien der nächsten beiden Horizonte fest.
- Farbe4 legt die Linienfarbe des vierten und aller folgenden Horizonte fest.