ZigZag Pointer Fibonacci Expansion Triangle
- Indikatoren
- Version: 1.0
- Aktivierungen: 5

Dieser Indikator zeigt die Bewegungen des ZigZag Pointer Fibonacci Expansion Triangle nur in den Zeitrahmen M1-W1 an.
Parameter
- Vertiefung: Zeigt die Depth-Bewegungen an.
- InDeviation: Zeigt die Abweichungsbewegungen an.
- InBackstep: Zeigt die Backstep-Bewegungen an.
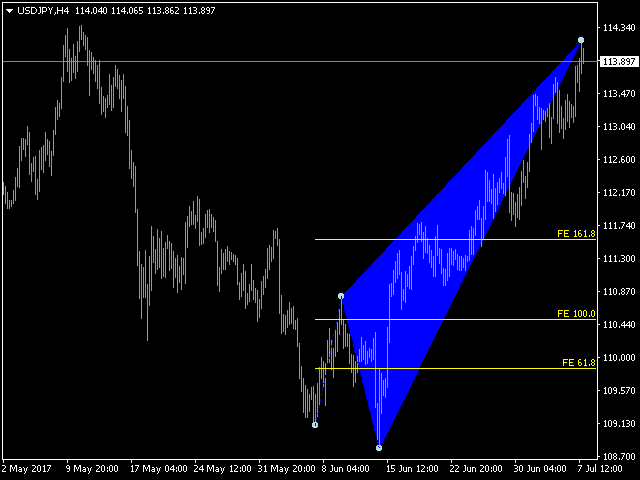
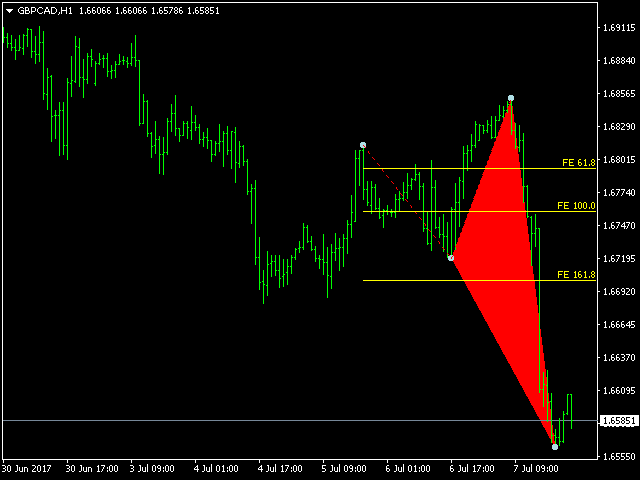
- Fibonacci-Ausdehnung: Zeigt die Bewegungen der Fibonacci-Expansion an. Fibonacci-Expansion wahr.(falsch)
- Dreieck: Zeigt die Dreiecksbewegungen an. Dreieck wahr.(falsch)
Wie ist der Status zu verstehen?
- Wenn das Dreieck grün ist, ist der Trend aufwärts gerichtet.
- Wenn das Dreieck rot ist, ist der Trend abwärts gerichtet.