Super Channel Pro Pluss
- Indikatoren
- Version: 1.0
- Aktivierungen: 5

Dieser Indikator Super Channel Pro Pluss indicator.indicator zeigt Trend Bewegung.indicator berechnet automatisch Linie.
Eigenschaften
- FiltPer -. zeigt Indikator Kanal Zeitraum.
- Abweichung zeigt die Abweichung des Indikatorkanals an.
- Abweichung2 - zeigt die zeigt die Abweichung des Indikatorkanals an.
- Abweichung3 - zeigt die zeigt die Abweichung des Indikatorkanals an.
Wie ist der Status zu verstehen?
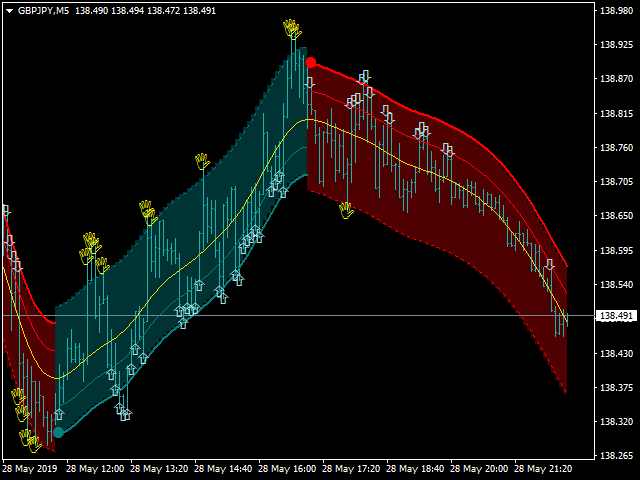
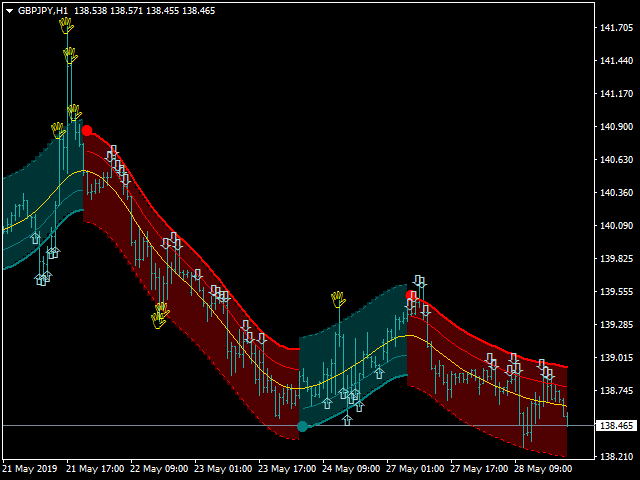
- Wenn der Pfeil nach oben zeigt und die Linienfarbe Teal ist, ist der Trend aufwärts gerichtet.
- Wenn der Pfeil abwärts zeigt und die Linie rot ist, ist der Trend abwärts.
- Wenn der Pfeil gelb ist, schließen ; (kaufen, verkaufen)
Indikator ; Balken zurück = WindowFirstVisibleBar()
//////////////////////////////////////////////////////////////////////////////////////////////////////////////////////////////////////////////////////
//////////////////////////////////////////////////////////////////////////////////////////////////////////////////////////////////////////////////////
//////////////////////////////////////////////////////////////////////////////////////////////////////////////////////////////////////////////////////
/////////////////////////////////////////////////////////////////////////////////////////////////////////////////////////////////////////////////////
/////////////////////////////////////////////////////////////////////////////////////////////////////////////////////////////////////////////////////
/////////////////////////////////////////////////////////////////////////////////////////////////////////////////////////////////////////////////////
/////////////////////////////////////////////////////////////////////////////////////////////////////////////////////////////////////////////////////
/////////////////////////////////////////////////////////////////////////////////////////////////////////////////////////////////////////////////////
/////////////////////////////////////////////////////////////////////////////////////////////////////////////////////////////////////////////////////
/////////////////////////////////////////////////////////////////////////////////////////////////////////////////////////////////////////////////////
/////////////////////////////////////////////////////////////////////////////////////////////////////////////////////////////////////////////////////
/////////////////////////////////////////////////////////////////////////////////////////////////////////////////////////////////////////////////////
/////////////////////////////////////////////////////////////////////////////////////////////////////////////////////////////////////////////////////
/////////////////////////////////////////////////////////////////////////////////////////////////////////////////////////////////////////////////////
/////////////////////////////////////////////////////////////////////////////////////////////////////////////////////////////////////////////////////
/////////////////////////////////////////////////////////////////////////////////////////////////////////////////////////////////////////////////////
/////////////////////////////////////////////////////////////////////////////////////////////////////////////////////////////////////////////////////
/////////////////////////////////////////////////////////////////////////////////////////////////////////////////////////////////////////////////////