Super
- Indikatoren
- Version: 1.0
- Aktivierungen: 5

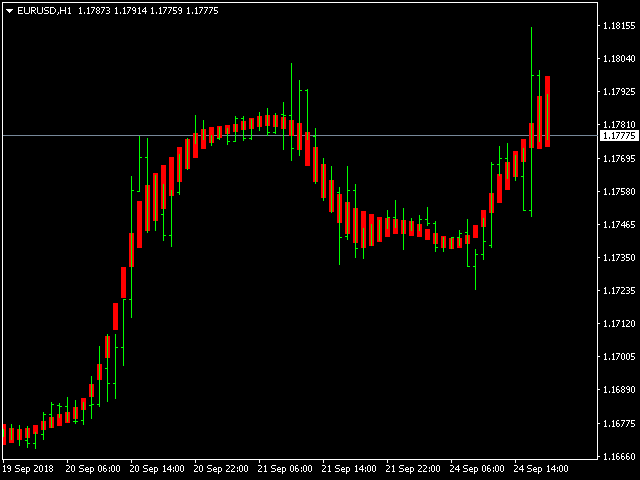
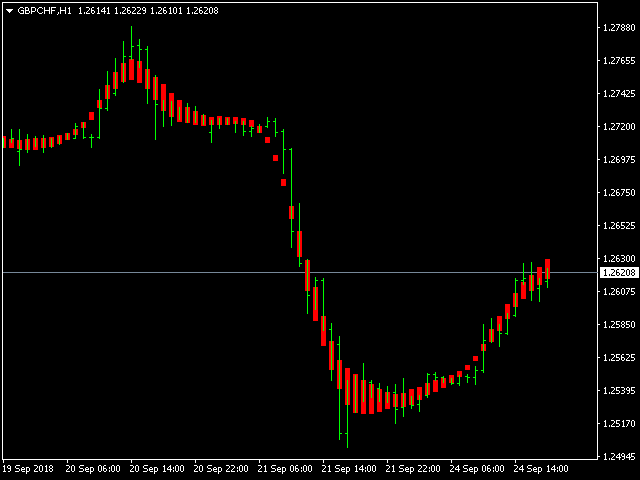
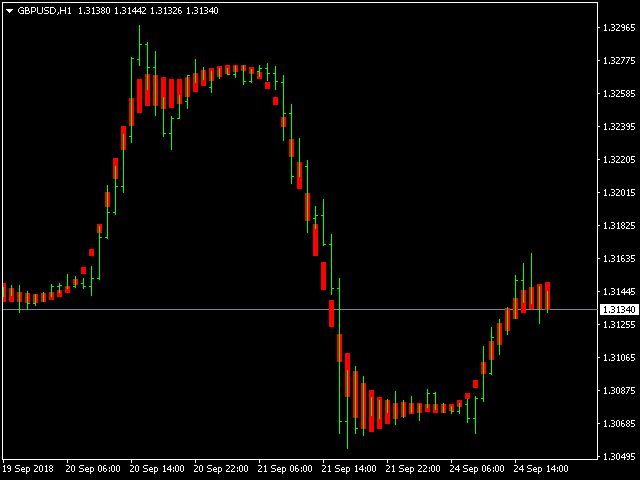
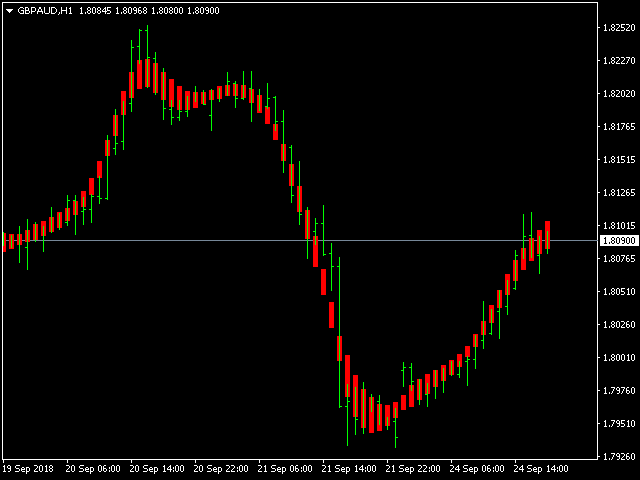
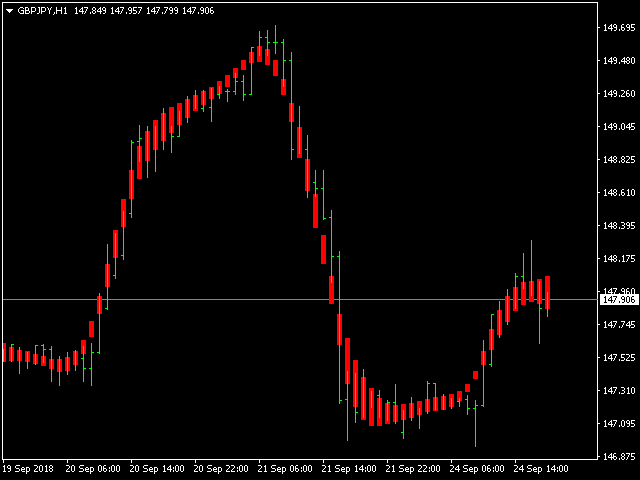
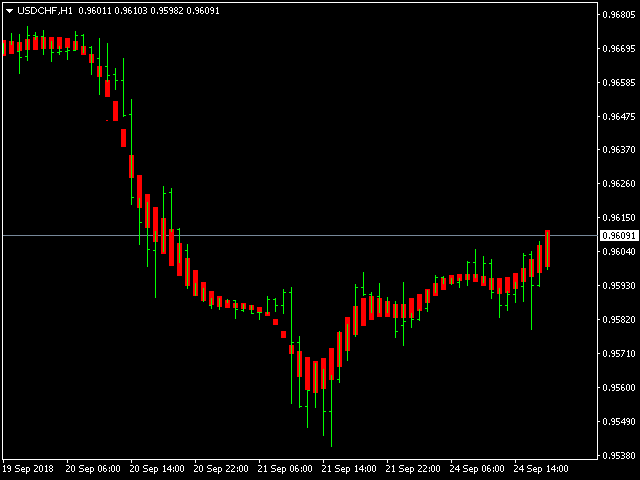
Dieser Indikator zeigt die Trendbewegungan undberechnet automatisch die Balken.
Eigenschaften
- FiltPer -. zeigt den Zeitraum des Indikators an.
- Multiplikator - zeigt den Multiplikator des Indikators an.
Wie der Status zu verstehen:
- Wenn der Indikatorbalken höher ist ist der Trend steigend.
- Wenn der Indikatorbalken niedriger ist , ist der Trend abwärts gerichtet.
IIIIIIIIIIIIIIIIIIIIIIIIIIIIIIIIIIIIIIIIIIIIIIIIIIIIIIIIIIIIIIIIIIIIIIII