Pluuto Alert Plus
- Indikatoren
- Version: 1.0
- Aktivierungen: 5

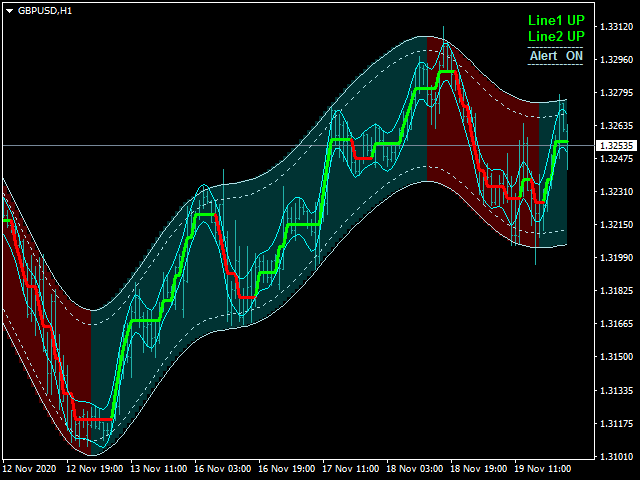
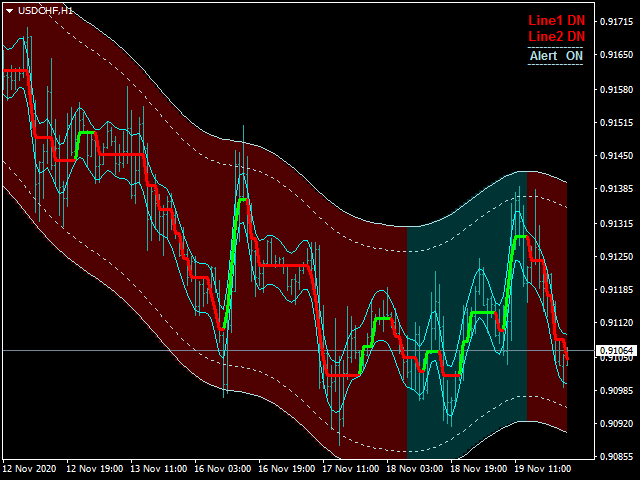
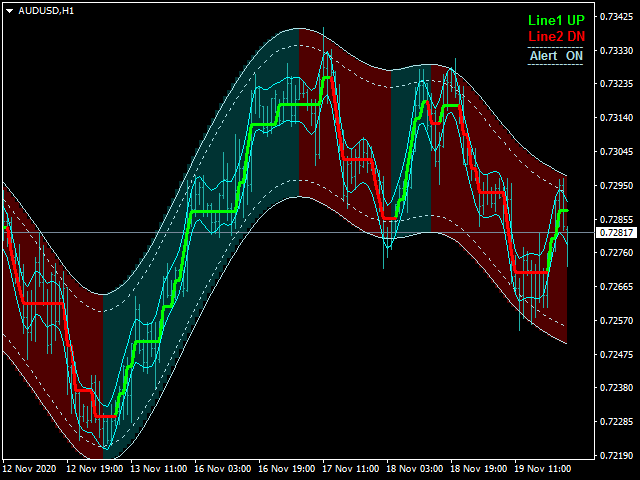
Dieser Indikator Pluuto Alert Plus indicator.indicator zeigt Trendbewegung.indicator berechnet automatisch line.Alert = FiltPer.Wenn der Alarm nach oben ist, ist der nächste Alarm nach unten, wenn der Alarm nach unten ist, ist der nächste Alarm nach oben (neue Bar).
Eigenschaften
- FiltPer - zeigt den Indikator period.Line1 an.
- FiltPer2 - zeigt den Indikator Periode.Linie2 an.
- Multiplier - zeigt den Multiplikator des Indikators an.(FlitPer,Line1;step)
- Deviation1 - zeigt die Abweichung des Indikators an.(Line2)
- Deviation2 - zeigt die Abweichung des Indikators an.(Line2)
- Deviation3 - zeigt die Abweichung des Indikators an.(Line1)
- Trend - zeigt den Trend des Indikators an (true/false).
- Trendalarm - zeigt den Trendalarm des Indikators an (wahr/falsch).
- X - verschiebt den Trend nach links und rechts.
- Y - bewegt den Trend nach oben und unten.
- Wenn die Trendfarbe grün ist, ist der Trend steigend.
- Wenn die Trendfarbe rot ist, ist der Trend abwärts gerichtet.
Wie der Status zu verstehen ist:
Indikator besten Zeitrahmen (M1-M30 FiltPer 30,FiltPer2 150),(H1-MN FiltPer 15 FiltPer2 100)
//////////////////////////////////////////////////////////////////////////////////////////////////////////////////////////////////////////////////////
//////////////////////////////////////////////////////////////////////////////////////////////////////////////////////////////////////////////////////
/////////////////////////////////////////////////////////////////////////////////////////////////////////////////////////////////////////////////////
///////////////////////////////////////////////////////////////////////////////////////////////////////////////////////////////////////////////////// /////////////////////////////////////////////////////////////////////////////////////////////////////////////////////////////////////////////////////
////