XR Power Trend
- Indikatoren
- Version: 1.0
- Aktivierungen: 5

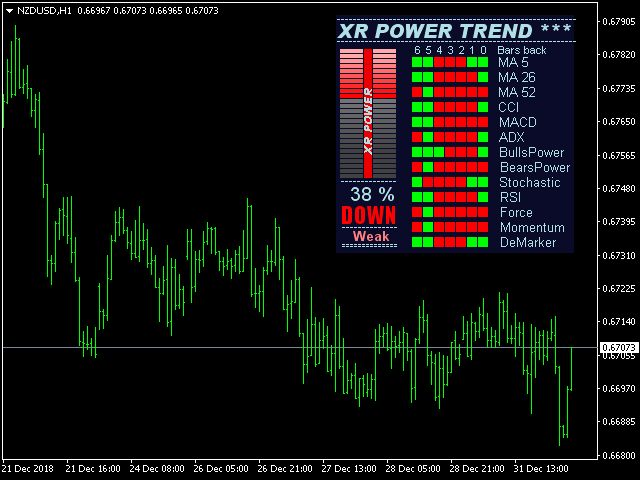
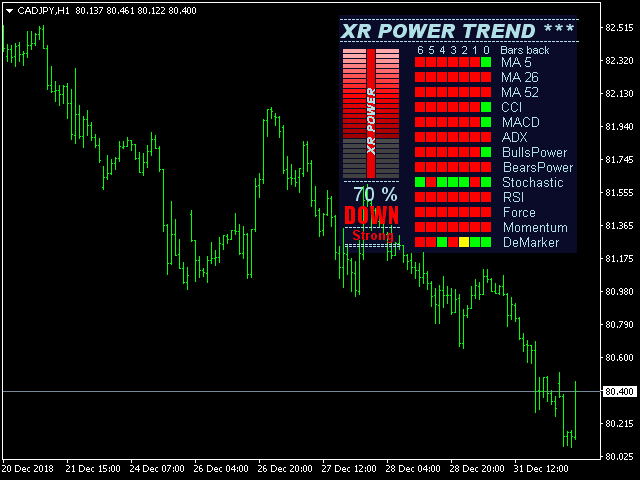
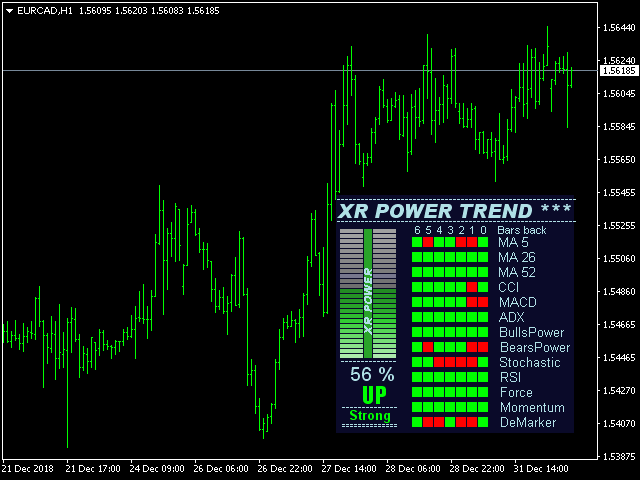
Dieser Indikator zeigt die Bewegung des XR Power Trend an: Gleitender Durchschnitt Periode 5, Gleitender Durchschnitt Periode 26, Gleitender Durchschnitt Periode 52, Commodity Channel Index, MACD, Average Directional Movement Index, Bulls Power, Bears Power, Stochastic Oscillator, Relative Strength Index, Force Index, Momentum, DeMarker, Average Movement, Indicators period is standard period.
Funktionen
- X - bewegt den Trend nach links und rechts.
Y - Bewegen Sie den Trend nach oben und unten.
Wie Sie den Status verstehen:
- Wenn die Trendfarbe grün ist, ist der Trend aufwärts gerichtet.
- Wenn die Trendfarbe rot ist, ist der Trend abwärts.

Author is unresponsive, indicator is defective as shown as in the comment section and you cannot personalize the settings based on personal preferences. Still have a dark box overlapping the screen, not a good product.