XR Combo
- Indikatoren
- Version: 1.0
- Aktivierungen: 5

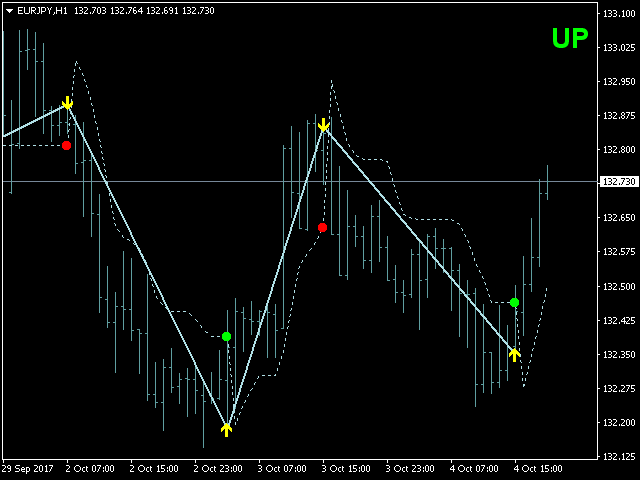
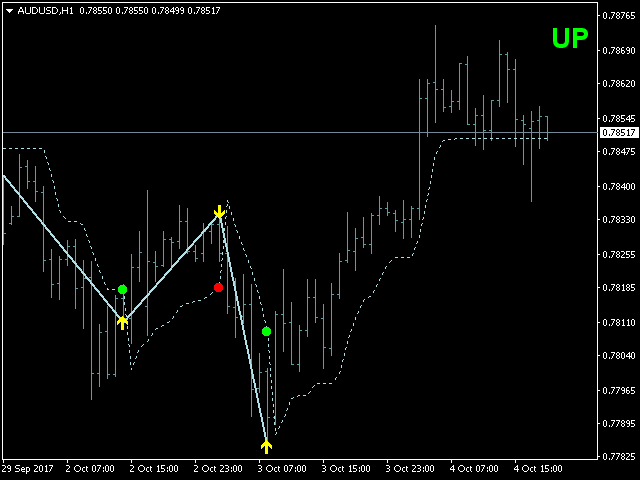
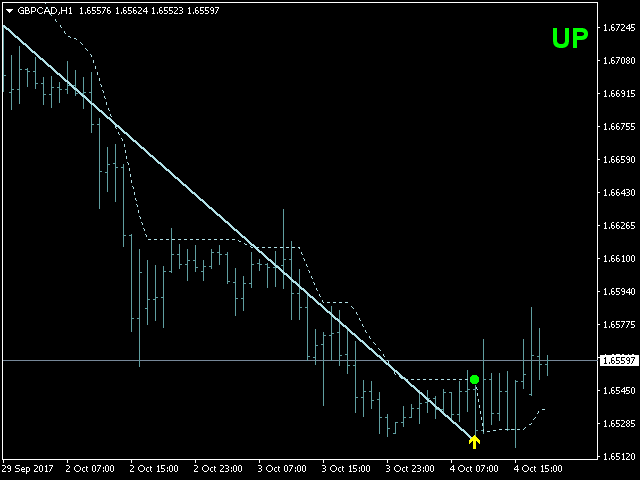
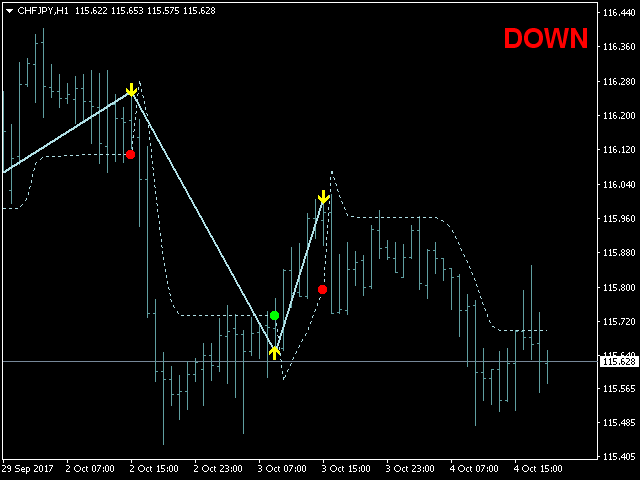
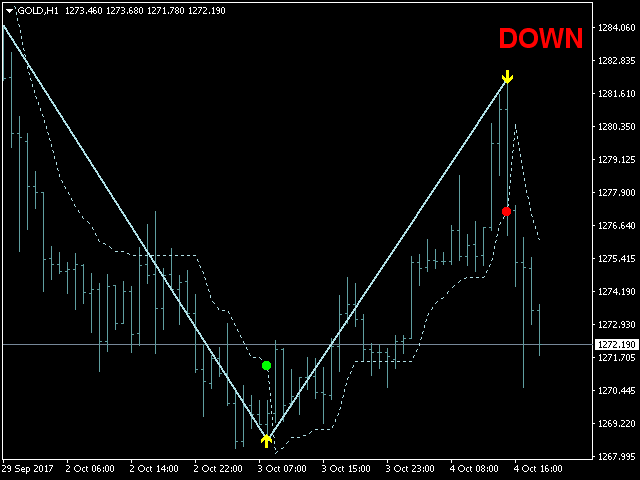
Dieser Indikator zeigt die Trendbewegungen an.
Parameter
- XRMultiplikator: XR-Multiplikator.
- Linie: Linienbewegung (wahr/falsch).
- XRzak: XRzak-Bewegungen (wahr/falsch).
- Arrow1: Pfeilbewegungen (wahr/falsch).
- Pfeil2: Pfeilbewegungen nach oben und unten (wahr/falsch).
- Trend: Trendbewegungen (wahr/falsch).
- X: Bewegt den Trend nach links und rechts.
- Y: Bewegt den Trend nach oben und unten.
Wie ist der Status zu verstehen?
- Wenn der Pfeil grün ist, ist der Trend steigend.
- Wenn der Pfeil rot ist, ist der Trend abwärts gerichtet.