Super XT
- Indikatoren
- Version: 1.0
- Aktivierungen: 5

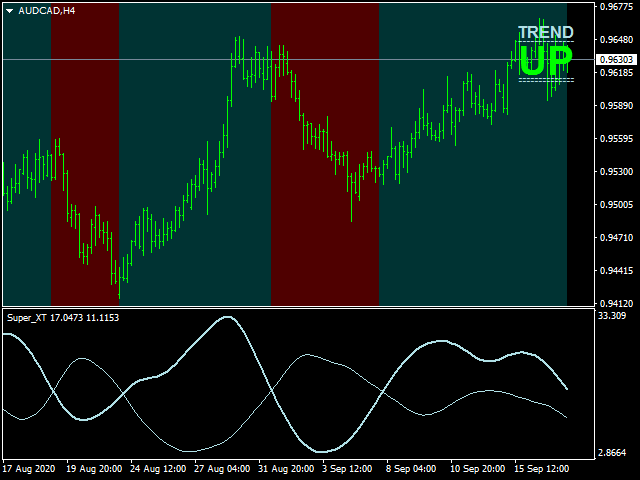
Dieser Indikator Super XT Indikator zeigt die Trendbewegungan und berechnet automatisch die Linie.
Eigenschaften
- FiltPer - zeigt den Zeitraum des Indikators an.
- Fenster - zeigt den Trend des Indikators (wahr/falsch).
- Trend - zeigt den Trend des Indikators an (wahr/falsch).
- X - Bewegt den Trend nach links und rechts.
- Y - Bewegt den Trend nach oben und unten.
So verstehen Sie den Status:
- Wenn die Trendfarbe grün ist, ist der Trend steigend.
- Wenn die Trendfarbe rot ist, ist der Trend rückläufig.
////////////////////////////////////////////////////////////////////////////////////////////////////////////////////////////////////////////////////////////////////////////////////////////////////////////////////////////////////////////////////////////////////////////////////////////////////////////
//////////////////////////////////////////////////////////////////////////////////////////////////////////////////////////////////////////////////////
/////////////////////////////////////////////////////////////////////////////////////////////////////////////////////////////////////////////////////
/////////////////////////////////////////////////////////////////////////////////////////////////////////////////////////////////////////////////////
///////////////////////////////////////////////////////////////////////////////////////////////////////////////////////////////////////////////////// /////////////////////////////////////////////////////////////////////////////////////////////////////////////////////////