Abiroid Support Resistance Scanner
- Indikatoren
-
Abir Pathak
 I create MT4 and MT5 indicators. They are mainly arrows and scanner indicators and also some essential utilities.
I'm hoping they will make your trading easier and make you profitable.
You can join my Telegram channel to keep track of all products I post. - Version: 1.5
- Aktualisiert: 15 November 2023
- Aktivierungen: 20
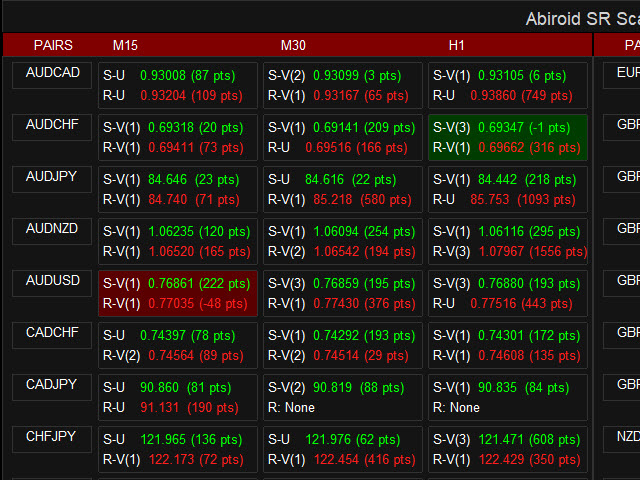
Dies ist ein Multi-Currency Multi-Timeframe Support/Resistance Scanner Dashboard für die Metatrader 4 (MT4) Plattform.
Erhalten Sie alle Extras und laden Sie die kostenlose Demo hier herunter:
https://www.mql5.com/en/blogs/post/760210
Lesen Sie die detaillierte Beschreibung im obigen Beitrag. Und holen Sie sich den SR Indikator für individuelle Charts.
Merkmale:
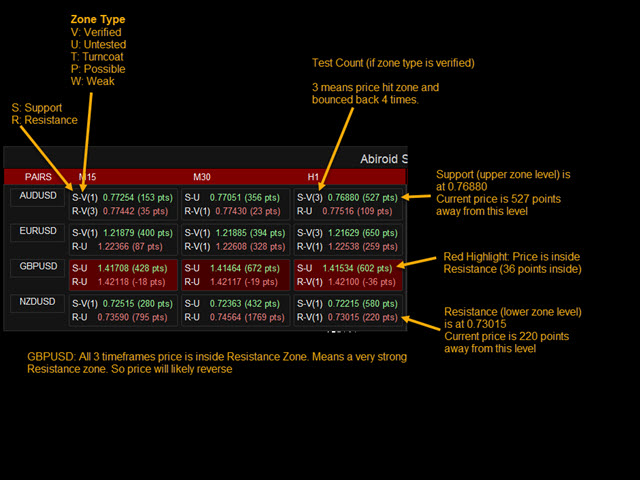
- Scannen von Support/Resistance-Zonen (auch Angebots-/Nachfragezonen genannt)
- Zeigt eine Warnung an, wenn der Preis innerhalb dieser Zonen liegt und hebt das Paar/den Zeitrahmen hervor
- Ein- oder Ausblenden des dem aktuellen Kurs (Price_Close) nächstgelegenen SR-Zonen-Kurses
- Entfernung des aktuellen Preises (Price_Close) in Punkten von den SR-Zonen anzeigen oder ausblenden
- Option zum Zusammenführen und Erweitern von Zonen
- MA-Filterung Alarme


Solid work, solid indicator!