Abiroid ProfitPercent Arrows Stoch Ichimoku
- Indikatoren
-
Abir Pathak
 I create MT4 and MT5 indicators. They are mainly arrows and scanner indicators and also some essential utilities.
I'm hoping they will make your trading easier and make you profitable.
You can join my Telegram channel to keep track of all products I post. - Version: 1.7
- Aktualisiert: 5 März 2023
- Aktivierungen: 20
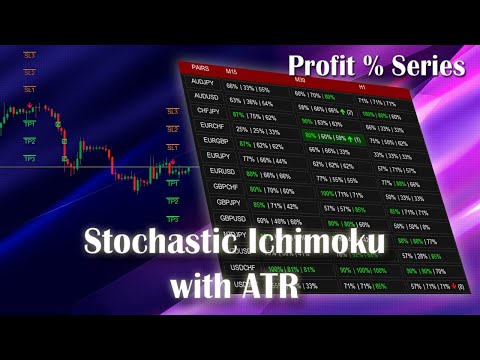
Abiroid Profit Percent Serie 1:
Pfeil-Indikator Stochastic Ichimoku mit ATR
Holen Sie sich den Scanner kostenlos. Für die Gewinnprozente für mehrere Timeframes und mehrere Paare.
Und lesen Sie die detaillierte Beschreibung dieses Indikators und aller Einstellungen hier. Und erhalten Sie zusätzliche Indikatoren, Templates und Einstellungen zum Download:
https://abiroid.com/product/profit-percent-stoch-ichimoku-with-atr
Sehen Sie sich das Tutorial-Video hier an:
Über die Strategie:
Diese Strategie besteht aus 3 Hauptteilen.
Hauptsignal, Trend Check und SL/TP Vorhersage:
1. Stochastik/RSI/CCI/Demarker OB/OS (Hauptsignal)
Hier können Sie mehrere Indikatoren verwenden (durch Komma getrennte Namen und Einstellungen)
Indikator1: (Hauptsignal)
Für KAUFEN: Überverkauft gekreuzt und zurück
Für VERKAUFEN: Überkauft gekreuzt und zurück
Stochastic beste Überkauft/Verkauft-Werte: 80/20. DeMarker beste OB/OS: 0.7/0.3Indikator 2+ (Validierungsindikatoren - optional)
Sowohl BUY- als auch SELL-Signale prüfen, ob Indikator 2 und mehr innerhalb des sicheren OverBought/Oversold-Bereichs liegen.
Sobald ein erfolgreiches Signal generiert wurde, wird der Trend geprüft. Alle Trendprüfungen sind optional.
2. Ichimoku oder EMA Higher TF (Trendprüfung optional)
Ichimoku verwenden:
Mögliche Checks (alle optional):
Für BUY:
Preis über Kumo Cloud (mindestens Min Distance away Points)
Tenkan über Kijun (Mindestabstand)
Chikou-Spanne entfernt und über Kumo-Wolke (Min. Abstand)
Chikou-Spanne entfernt und über Preis (Min. Abstand)
Für SELL, gleiche Einstellungen nur umgekehrt
EMA für höhere Zeitrahmen verwenden (auch optional):
Sie können die Anzahl der höheren Zeitrahmen angeben, für die Sie den EMA-Trend prüfen möchten.
Wenn Sie auf M30 handeln und die EMA HTF Nummer auf "3" setzen
Dann wird der Trend für den aktuellen Zeitrahmen M30 und 2 höhere Zeitrahmen H1 und H4 geprüft.
Wenn es sieht, dass alle Trends übereinstimmen, wird es das KAUF/VERKAUF-Signal zulassen.
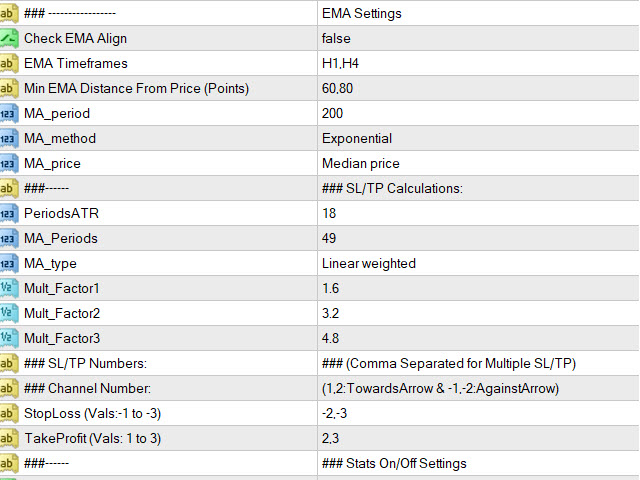
3. ATR (SL/TP-Vorhersage)
Der Take Profit und der Stop Loss werden mit Hilfe der ATR-Kanäle vorhergesagt. Es sind 6 Kanäle verfügbar.
Sie können festlegen, welcher Kanal für TP und SL verwendet werden soll.
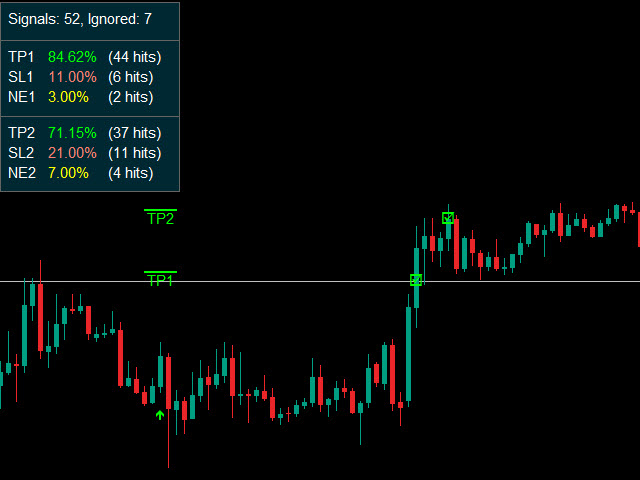
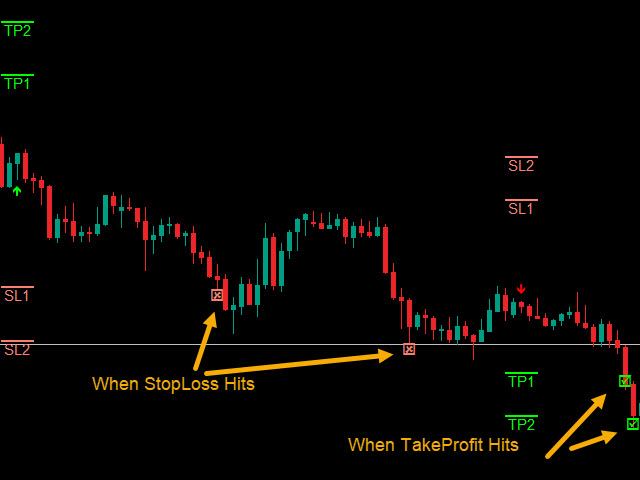
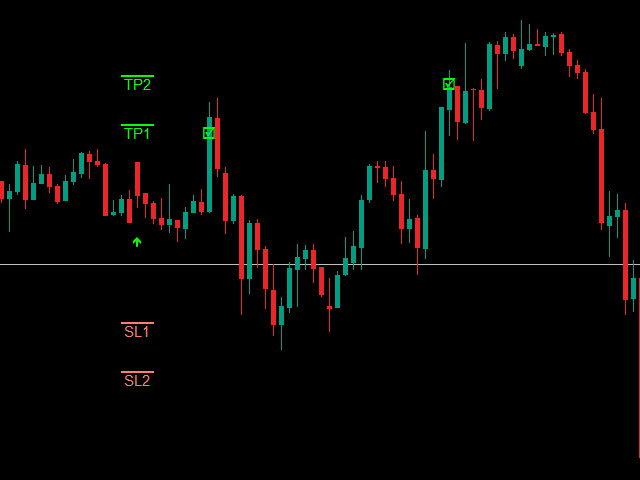
Angenommen, Sie verwenden TP1,TP2,TP3 und SL1,SL2,SL3, wie in der Abbildung gezeigt:
Es werden die vergangenen Bars verglichen und geprüft, ob TP1 oder SL1 getroffen wurde. TP2 wird mit SL2 verglichen und so weiter.
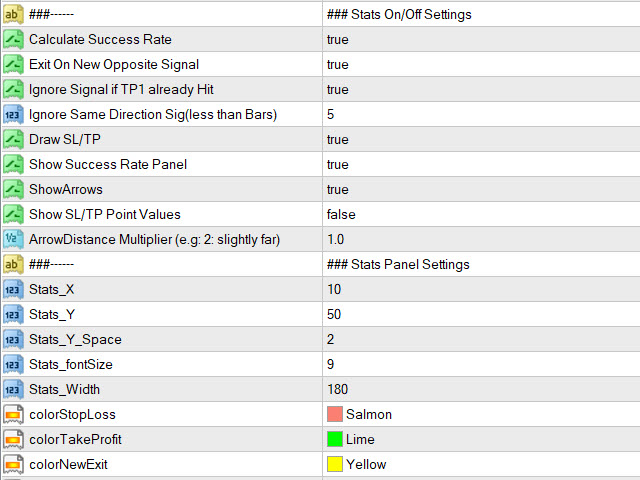
Der Indikator zeigt Ihnen den Prozentsatz der erfolgreichen TP1, 2 oder 3 Profits. Oder erfolglose Treffer und Verluste mit SL Prozentsatz.