Semafor 3LZZ Scanner Dashboard
- Indikatoren
-
Abir Pathak
 I create MT4 and MT5 indicators. They are mainly arrows and scanner indicators and also some essential utilities.
I'm hoping they will make your trading easier and make you profitable.
You can join my Telegram channel to keep track of all products I post. - Version: 1.13
- Aktualisiert: 22 März 2023
- Aktivierungen: 20
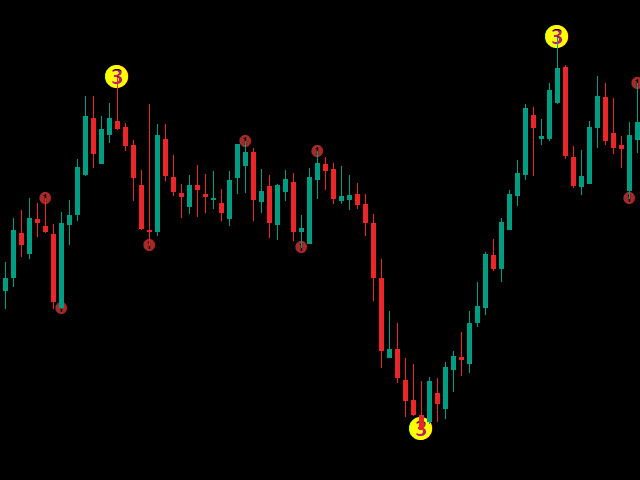
3 Level ZZ Semafor Scanner:
Dies ist ein Dashboard-Indikator, der den 3LZZ-Indikator im Hintergrund verwendet, um Semafors zu finden.
Er gibt den Semafors3 den Vorrang, weil sie ein starkes Signal angeben.
Also, auch wenn es ein Sem1 oder 2 auf der aktuellen Bar, und wenn Sem3 war innerhalb "Check Previous Bars für Sem 3". Dann wird stattdessen Sem3 angezeigt.
Lesen Sie darüber in einem ausführlichen Beitrag:
https://www.mql5.com/en/blogs/post/758250
Und holen Sie sich alle zusätzlichen Indikatoren/Vorlagen über den obigen Link.
Please note: Number of settings has reached over 60. So, I won't be adding new features to it.
Ich werde weiterhin Support und Fehlerbehebungen für diesen Scanner anbieten. Aber ich werde nicht in der Lage sein, weitere Einstellungen hinzuzufügen.
Denn viele Leute verwenden ihn in Kombination mit ihren eigenen EAs.
Um diese Vorlage zu verwenden, geben Sie einfach "3LZZ" in der Dashboard-Eigenschaft an: "Vorlage für neues Fenster verwenden" (ohne die Anführungszeichen)
Der Scanner scannt jeden Balken nur einmal für 3LZZ. Er aktualisiert jedoch jeden neuen Balken. Wenn Ihr niedrigster Zeitrahmen auf dem Dashboard zum Beispiel M5 ist, setzen Sie den aktuellen Chart-Zeitrahmen ebenfalls auf M5. Es wird also alle 5 Minuten aktualisiert.
Oder verwenden Sie "Refresh After Ticks", um jede angegebene Anzahl von Ticks zu aktualisieren, wenn Shift 0 ist.
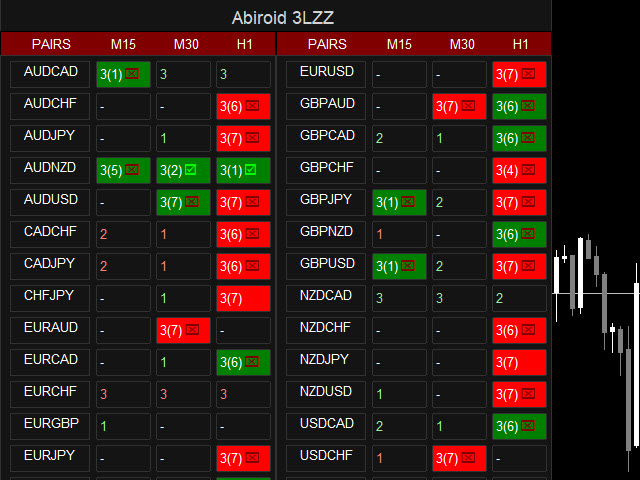
Was die einzelnen Schaltflächen bedeuten (Beispiele):
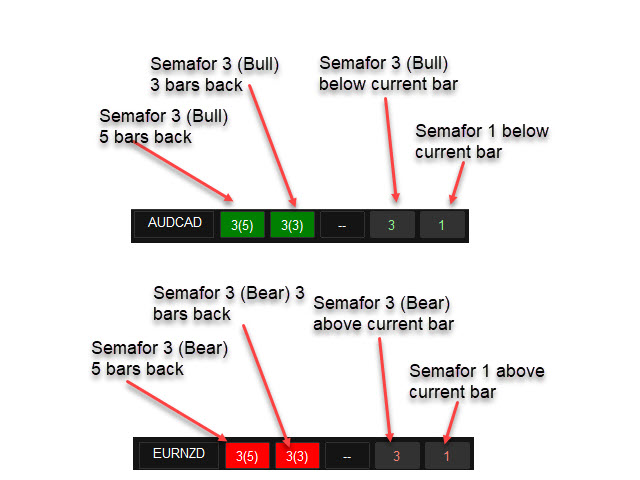
Grüne Schrift 1 oder 2 oder 3: Bearish Semafor 1 oder 2 oder 3 auf dem aktuellen Balken
Rote Schrift 1 oder 2 oder 3: Bearish Semafor 1 oder 2 oder 3 auf dem aktuellen Balken
Orange 1/1 oder 2/2 oder 3/3: Sowohl Bullish- als auch Bearish-Semafors auf dem aktuellen Balken (kommt sehr selten vor)
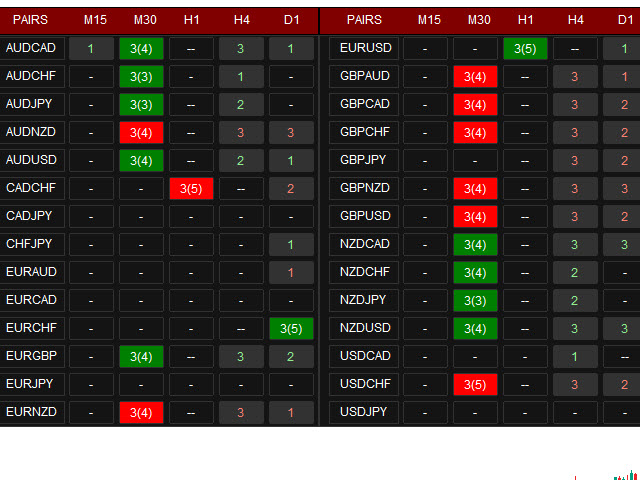
Grüner Block 3(4): Bullish Semafor 3 ist 4 Bars zurückliegend aufgetreten
Roter Block 3(2): Bearish Semafor 3 ist 2 Balken zurück aufgetreten
Buchstabe S: Bedeutet, dass die Stochastik den überkauften oder überverkauften Bereich im Stochastik-Zeitrahmen gekreuzt hat
z.B.: Wenn Sie Main TF: M15,M30,H1 und Stoch HigherTimeframes M30,H1,H4 behalten. Für M15 wird die Stochastikprüfung also für M30 durchgeführt.
- Keine Semafors
-- Semafor 3 in vorherigen Bars, aber ausgeblendet, weil der höhere Timeframe einen aktuellen Bar-Semafor hat
(Siehe Screenshots für Beispiele)
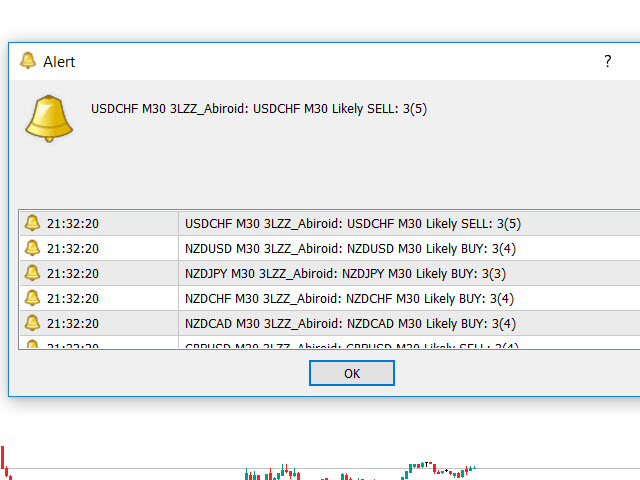
Warnungen:
Popup-Warnungen, E-Mail-Warnungen oder Push-Benachrichtigungen. Kann in den Indikatoreigenschaften festgelegt werden.
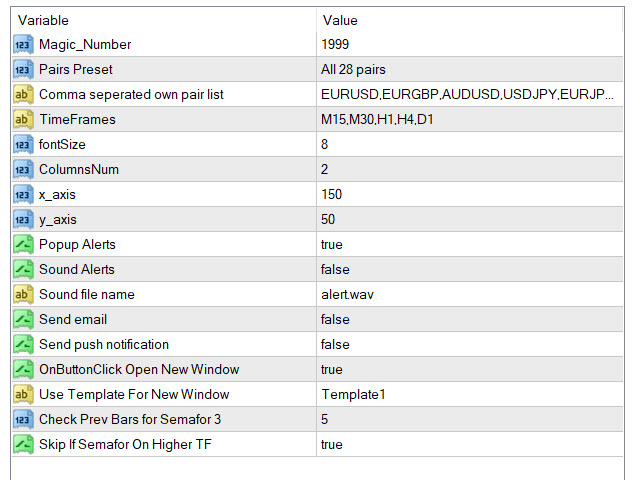
Einstellungen:
Siehe allgemeine Scanner-Einstellungen hier:
https://www.mql5.com/en/blogs/post/747456
- Check Previous Bars for Semafor 3: Geben Sie die Anzahl der vorherigen Bars an, für die Semafor 3 geprüft werden soll.
- Überspringen, wenn Semafor auf höherem Zeitrahmen: Wenn wahr: Wenn sich ein Semafor noch auf einem höheren Timeframe bildet, dann blenden Sie alle vorherigen Semafors auf dem gerade niedrigeren Timeframe aus. Und zeige nur den doppelten Strich "--".
Denn wenn ein höherer TF-Semafor noch läuft, könnte sich der Preis noch bewegen. Daher ist es am besten, auf das Ende des Balkens zu warten.
Warnung Semafor bei Bar 3(x): Alarm für Semafor am (x) vorherigen Balken anzeigen
Wie man handelt:
Am besten verwenden Sie diesen Indikator in Verbindung mit Support und Resistance, Pivots, Quartalen usw. Oder mit jedem anderen Indikator, der die Umkehr bestätigen könnte.
Unterstützungs-/Widerstandsniveaus helfen Ihnen auch bei der Festlegung des SL/TP.


best Dashboard