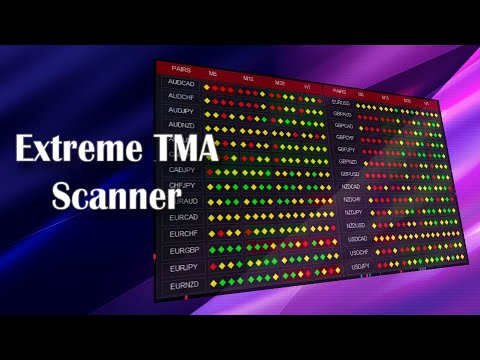
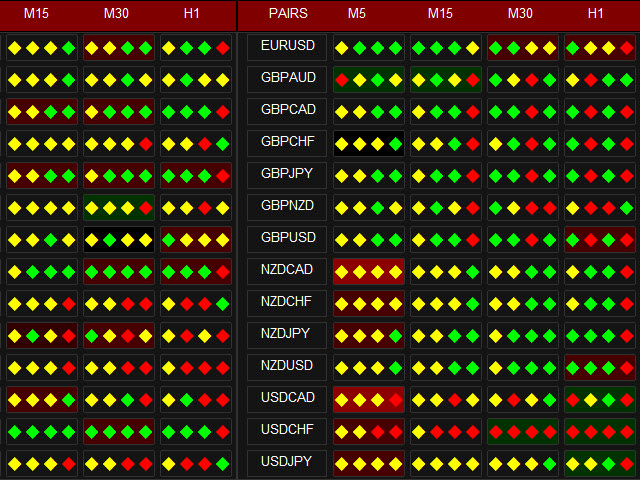
Abiroid Extreme TMA System Scanner Dashboard
- Indikatoren
-
Abir Pathak
 I create MT4 and MT5 indicators. They are mainly arrows and scanner indicators and also some essential utilities.
I'm hoping they will make your trading easier and make you profitable.
You can join my Telegram channel to keep track of all products I post. - Version: 1.13
- Aktualisiert: 29 April 2023
- Aktivierungen: 20
Dieses Scanner Dashboard verwendet den Extreme TMA System Arrows Indicator, um gute KAUF/VERKAUF-Signale anzuzeigen.
Dieses Produkt enthält nur das Dashboard. Es enthält nicht den Abiroid_Arrow_Extreme_TMA.ex4 Indikator.
Der Arrows-Indikator ist nicht erforderlich, damit das Dashboard funktioniert.
Um Pfeile zu sehen, können Sie die Pfeile Indikator separat kaufen, wenn Sie möchten:
https:// www.mql5.com/en/market/product/44822
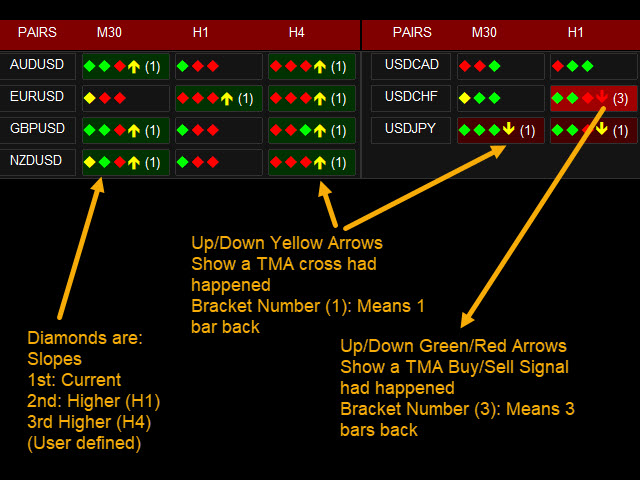
Dash zeigt die Steigungen für aktuelle und höhere Zeitrahmen.
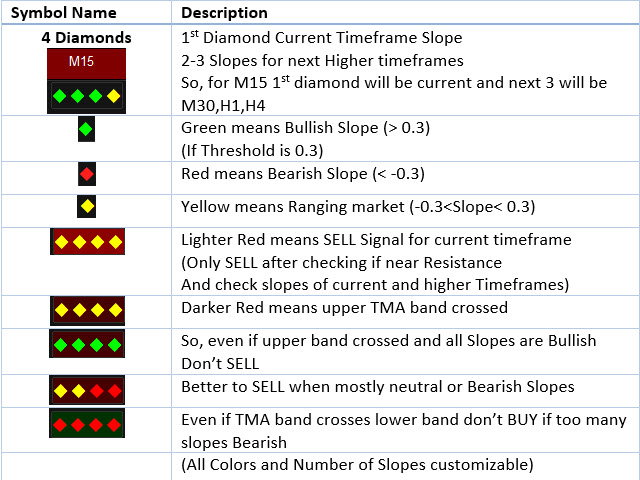
- Die erste Raute ist der aktuelle TF. Die nächsten Rauten sind höhere TFs
- Der letzte Pfeil ist ein TMA-Signal:(Bitte beachten Sie: Die Slope-Berechnung verwendet ATR und TMA für mehrere vergangene Bars. Wenn Sie also zu viele Steigungen für viele Paare und Zeitrahmen haben, kann das Dashboard langsam werden.
Wenn Sie z.B. 4 Steigungen für 28 Paare und 4 TFs haben, wird das Dashboard je nach Ihrem PC in etwa 30-40 Sekunden geladen).
Gelber Pfeil: Der Preis hat das TMA-Band nach oben oder unten durchquert
Roter/Grüner Pfeil: Preis kehrt um und erreicht niedrigere Tiefststände (VERKAUFEN) oder höhere Höchststände (KAUFEN) des vorherigen Balkens
- Die Klammer zeigt die Anzahl der Balken an, hinter denen das Signal aufgetreten ist.
BG Dunkelgrün: Preis unter dem unteren Band und Umkehrung.
BG Dunkelrot: Kurs über oberem Band und Umkehrung.
Wenn ein BUY/SELL-Signal auftritt, wird der Block grün/rot.
KAUFEN/VERKAUFEN:
- Wenn useRSI wahr ist und der Preis überkauft/überverkauft ist
- Wenn checkCurrentTFSlope oder checkHTFSlope wahr ist - einen Slope-Check durchführen, wie im nächsten Abschnitt beschrieben
- Wenn "Ignorieren, wenn TakeProfit zu nahe ist" wahr ist - und der Preis unter dem Prozentsatz "Min Distance from TakeProfit" liegt.
Wenn alle Bedingungen erfüllt sind, erhalten Sie ein KAUF- oder VERKAUFSSIGNAL und eine Warnung. KAUFEN ist grünes BG. VERKAUFEN ist ein rotes BG.
Kanäle prüfen:
TMATrue (Nicht-Wiederholung)
FastLineTMA (Übermalungen) Von der ursprünglichen Extreme TMA Strategie
TMA+CG (Umfärbungen)
TMA+CG ist etwas langsamer als die anderen - daher kann das Laden länger dauern, wenn mehrere Paare/Zeitrahmen verwendet werden.
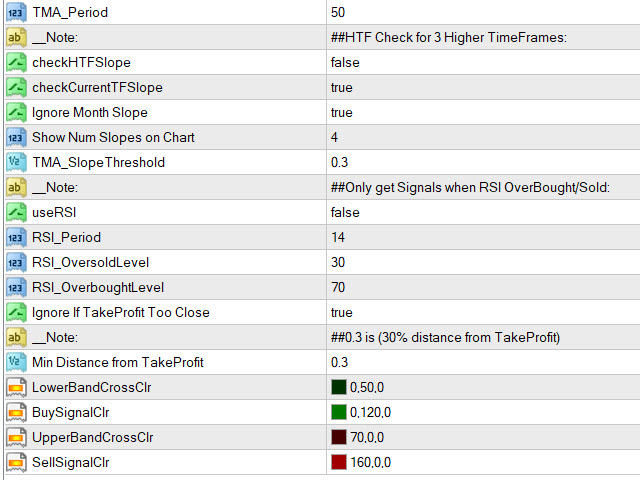
Neigungsprüfung:
Optionen:
Neigung1 (neu lackiert)
Piste2 (nicht neu lackiert)
Wenn SlopeThreshold 0.3 ist.
Slope < -0.3 bedeutet Bearish. Zeige nur SELL-Signale.
Slope > 0.3 bedeutet Bullish. Nur BUY-Signale anzeigen.
Slope zwischen -0.3 und 0.3 bedeutet, dass der Markt schwankt. Zeigt sowohl KAUF- als auch VERKAUFSSIGNALE an
Berechnung des Take Profit-Abstands:
MinDistance ist 0.3 bedeutet 30%
100% Abstand ist zwischen oberem/unterem Band und mittlerem Band.
Abstand zwischen oberem/unterem Band und Startpreis ist bereits mehr als 30%, dann ignorieren Sie das Signal.
Indikator-Einstellungen:
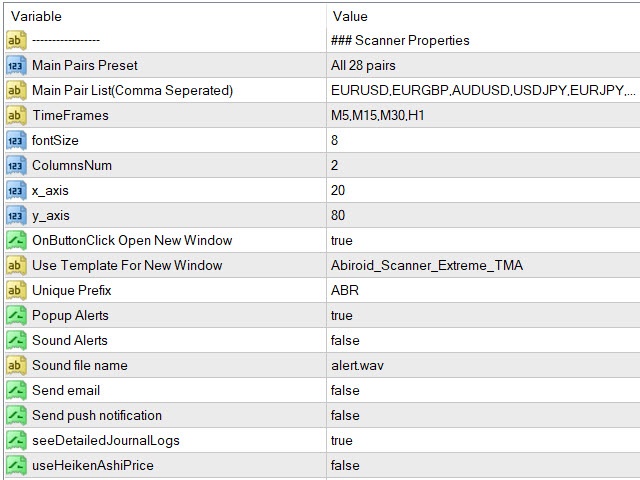
Lesen Sie die detaillierten Dashboard-Einstellungen hier: - TMA_Period = 50 (Triangular Moving Average Period)
- ATR_Period = 100
- ATR Multiplier oder Bands Deviation (Kanäle näher oder weiter verschieben)
- checkHTFSlope = false (Slope für die nächsten 3 höheren TF prüfen)
- checkCurrentTFSlope = true (Slope für den aktuellen TF prüfen)
- ignoreMNSlope = true (Monatlichen Slope ignorieren oder nicht)
- TMA_SlopeThreshold = 0.3 (Slope Threshold für die Überprüfung von Bullish/Bearish)
- useRSI = false (Wenn Use RSI true - trade nur BUY wenn RSI OverSold und SELL wenn RSI OverBought)
- RSI_Period = 14
- RSI_OversoldLevel = 30
- RSI_ÜberkauftLevel = 70
- ignoreTooCloseMiddleBand = true (TakeProfit wird irgendwo in der Nähe des mittleren Bandes liegen. Der Preis hat das mittlere Band zu nahe erreicht - Signal ignorieren)
- minDistFromMiddleBand = 0.3 (0.3 bedeutet 30% Abstand vom mittleren Band. Wenn ignoreTooCloseMiddleBand true ist und der Preis mehr als 30% Abstand vom mittleren Band erreicht, wird das Signal ignoriert)
- Vergangene Bars suchen nach TMA-Signal: Vergangene Bars für TMA Cross oder Up/Down Signal
"Do Past Arrow Search At Start": Wenn true, werden die angegebenen PastBars beim ersten Laden des Dash untersucht und es wird angezeigt, welcher Pfeil der letzte war. Bei "false" werden nur neue Balken untersucht und die Pfeilwerte in Klammern aktualisiert, sobald sie auftreten.
Wenn "Do Past Arrow Search At Start" true und "Past Bars Search For TMA Signal" eine hohe Zahl ist, kann das Dashboard langsamer werden.
Anregung: Wenn Sie sich viele vergangene Balken ansehen möchten, lassen Sie diese Option auf false. Und suchen Sie nur nach neuen Balken.
Pfeil (Zahl): Anzahl der Balken, bei denen ein Kreuz aufgetreten ist.
Pfeil (+): Der Kurs liegt noch außerhalb der TMA-Bänder. Also weiter zurückschauen.


Very good dashboard. Individually adaptable to your own special needs. These trading signals to the mobile phone save countless hours in front of the computer. Very good product! Very good price.