Oscillator Predictor MT5
- Indicadores
- Versión: 1.1
- Actualizado: 13 mayo 2023
- Activaciones: 15

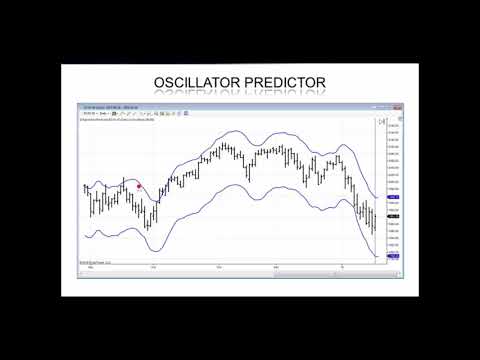
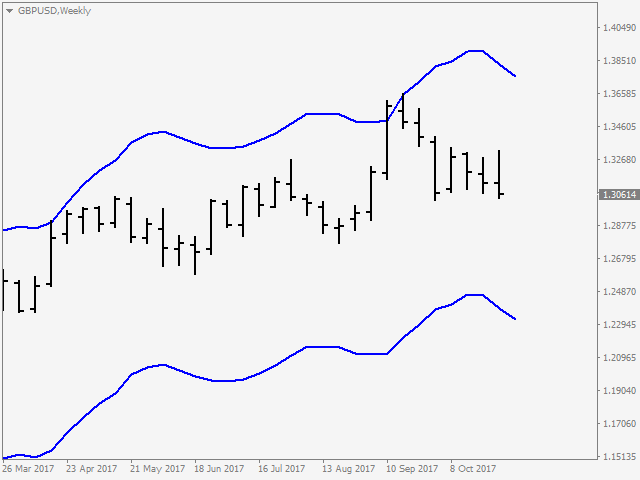
Indicador muy especial de Joe Dinapoli que es un derivado de un Oscilador Detrended. A través de un conjunto de ecuaciones paramétricas, se crea un oscilador predictor que pronostica, con un periodo de antelación, las condiciones de sobrecompra y sobreventa.
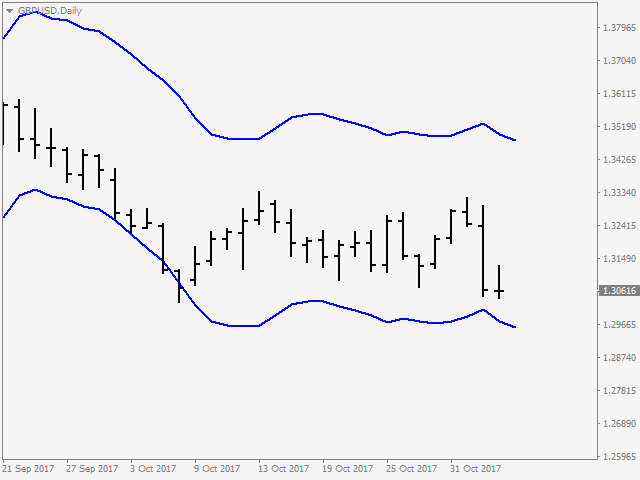
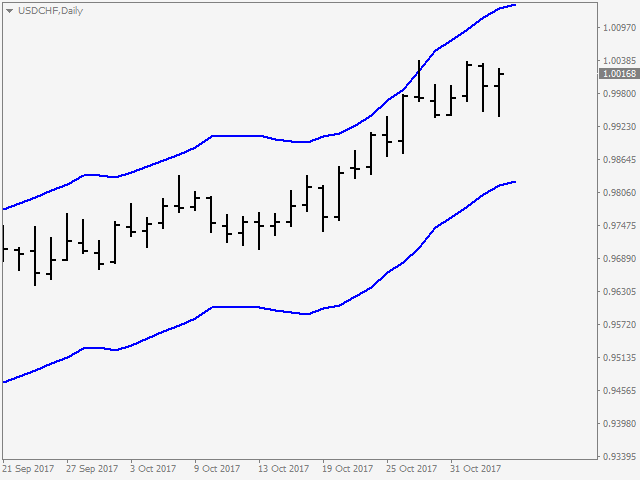
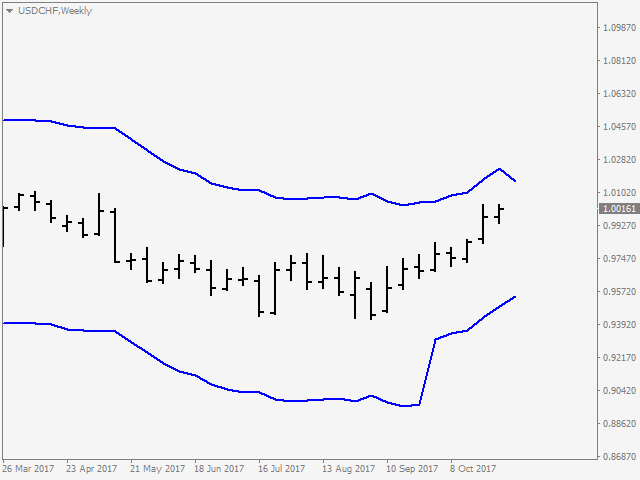
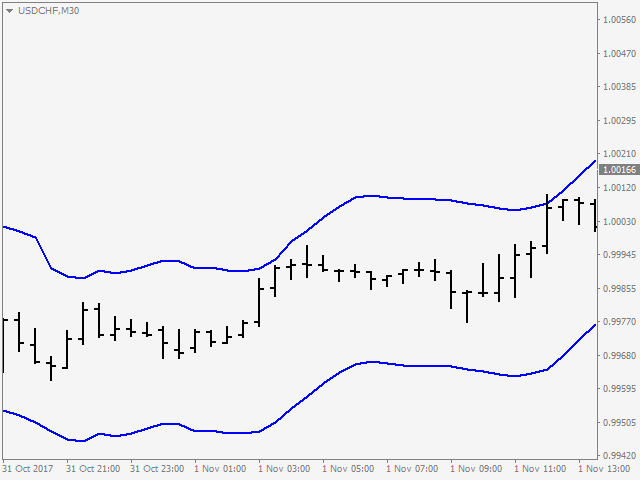
Los valores de predicción resultantes se expresan en forma de bandas en el gráfico de barras, tanto por encima como por debajo del mercado. Puede confundirse con una banda de Bollinger, pero no tiene ningún parecido.
Las bandas del Predictor pueden utilizarse de diversas formas para ayudar a entrar y salir del mercado.
Aunque se recomienda para H4 y marcos de tiempo superiores, puede ser particularmente útil para el comercio intradía.
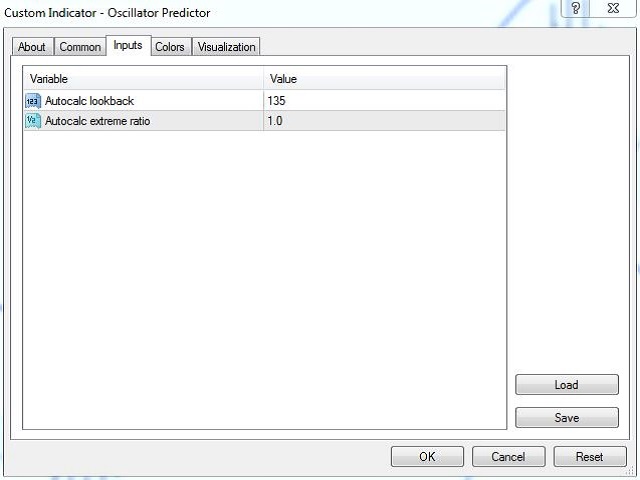
Entradas
- Autocalc Lookback - número de barras utilizadas para calcular la condición de sobrecompra y sobreventa.
- Autocalc extreme ratio - ratio porcentual utilizado para establecer las condiciones máximas de sobrecompra y sobreventa.
***Por favor, no dude en hacerme cualquier pregunta sobre este indicador... ¡Estaré aquí para mostrarle cómo utilizar este indicador hasta que esté completamente satisfecho!
Para MT4 Versión; por favor visite ► https://www.mql5.com/en/market/product/52625
Para Mis Otros Productos; por favor visite ► https://www.mql5.com/en/users/samil34
El usuario no ha dejado ningún comentario para su valoración