Oscillator Predictor MT5
- Göstergeler
- Sürüm: 1.1
- Güncellendi: 13 Mayıs 2023
- Etkinleştirmeler: 15

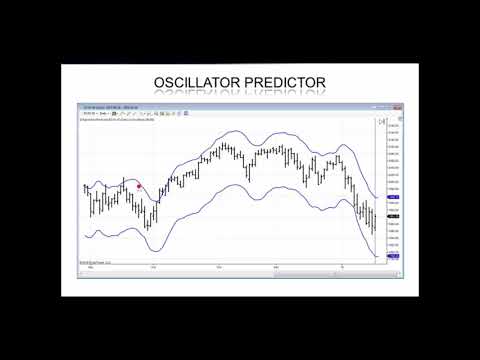
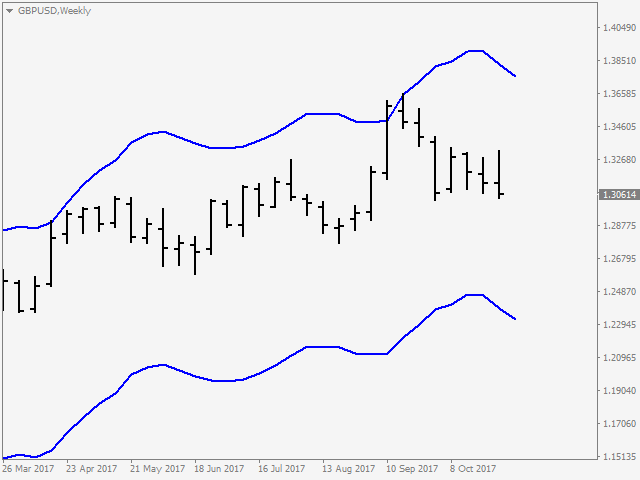
Very special indicator of Joe Dinapoli which is a derivative of a Detrended Oscillator. Through a set of parametric equations, a predicting oscillator is created that forecasts, one period ahead of time, overbought and oversold conditions.
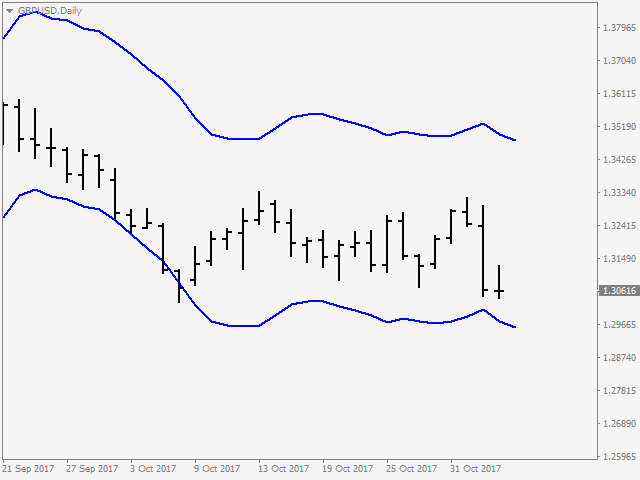
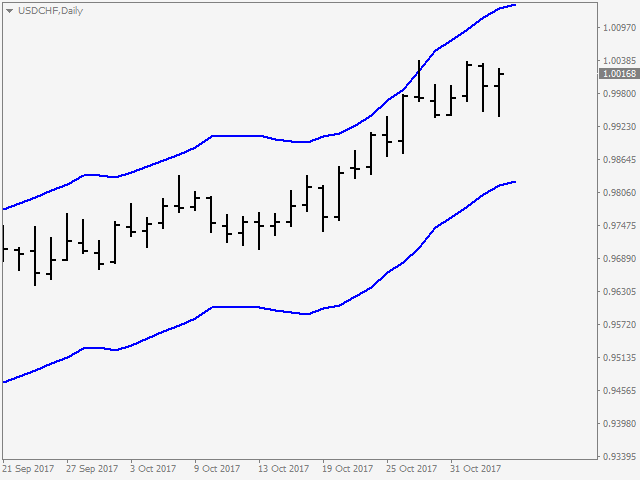
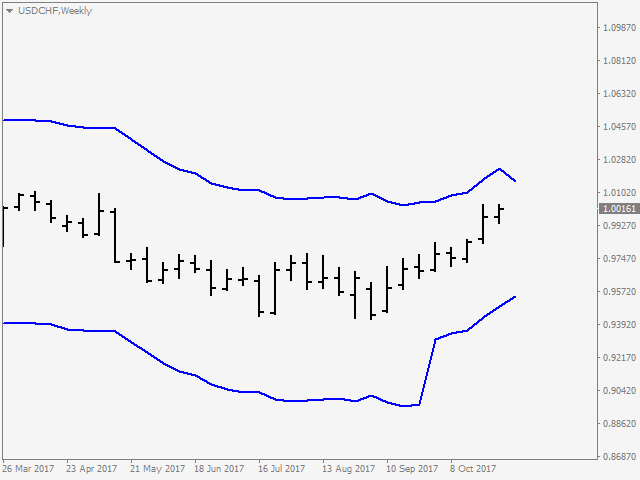
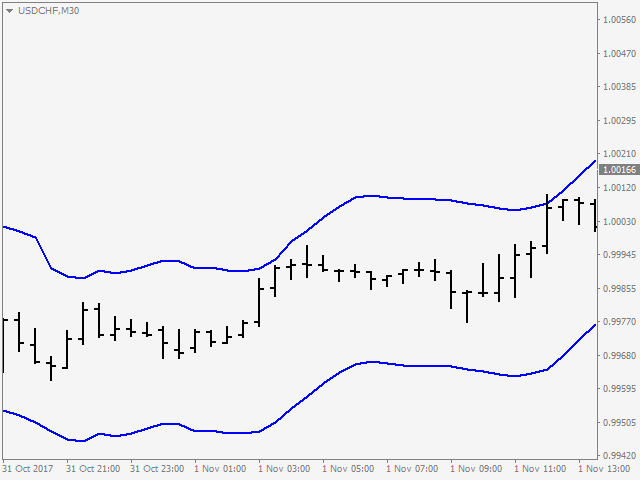
The resulting predictor values are expressed as bands on the bar chart, both above and below the market. It may be mistaken as a Bollinger Band but has no resemblance to it whatsoever.
The Predictor bands may be used in a variety of ways to aid in entering and exiting the market.
Although it is recommended for H4 and higher timeframes, it can be particularly useful for intra-day trading.
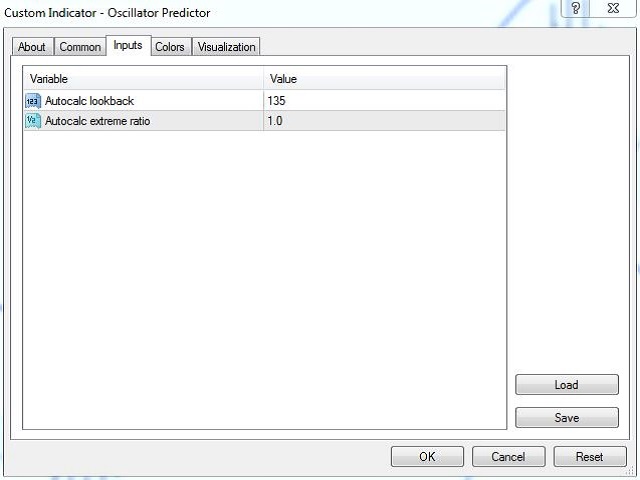
Inputs
- Autocalc Lookback - number of bars used to calculate overbought and oversold condition.
- Autocalc extreme ratio - percent ratio used to set maximum overbought and oversold condition.
***Please do not hesitate to ask me any questions regarding this indicator... I will be here to show you how to use this indicator until you are fully satisfied !
For MT4 Version; please visit ► https://www.mql5.com/en/market/product/52625
For My Other Products; please visit ► https://www.mql5.com/en/users/samil34
Kullanıcı değerlendirmeye herhangi bir yorum bırakmadı