PowerMeter Currencies Table1
- Indikatoren
- Version: 4.51
- Aktualisiert: 11 September 2020
- Aktivierungen: 5

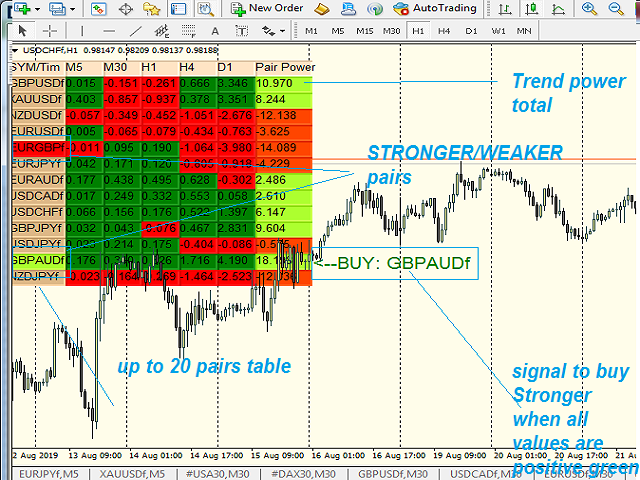
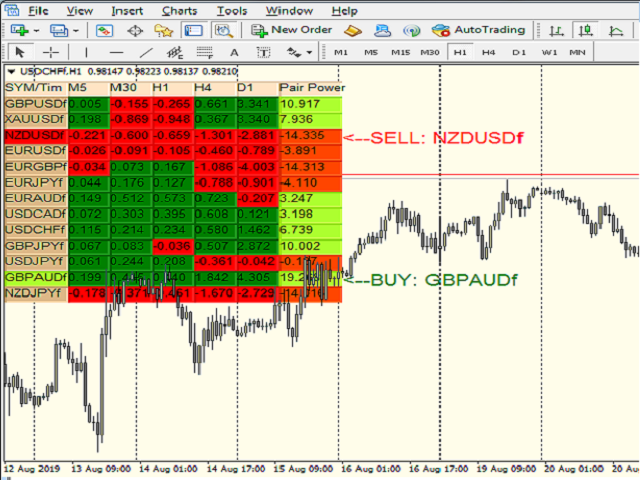
SYMBOL POWER basiert auf 5 eingegebenen Zeitrahmen und wird mit 20 anderen Symbolen verglichen !! Großartiger Indikator
SIE MÜSSEN NICHT ALLE ZEITRAHMEN FÜR JEDES WÄHRUNGSPAAR DURCHGEHEN, UM DEN TREND UND DIE KRAFT ZU ERKENNEN
SIE HABEN ALLES IN EINER TABELLE, 20 WÄHRUNGSPAARE MIT 5 ZEITRAHMEN
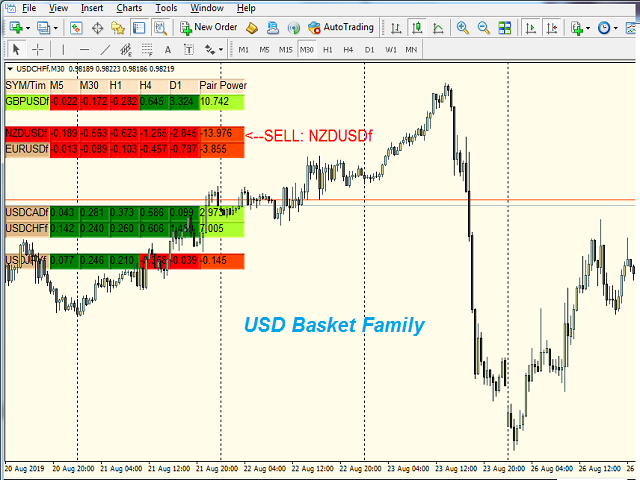
VERGLEICHEN SIE AUCH DIE STÄRKE DER EINZELNEN WÄHRUNGEN
UND WARNT DAS STÄRKERE/SCHWÄCHERE PAAR BASIEREND AUF 5 ZEITRAHMEN BERECHNUNGEN
ALEERTS aktivieren/deaktivieren
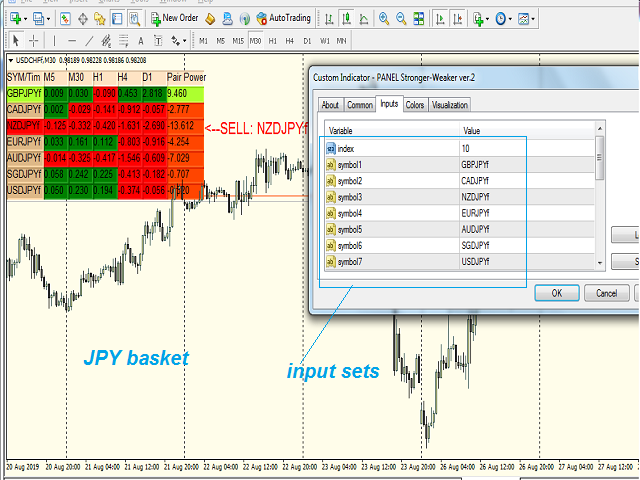
mit 5 Zeitrahmen M5 M30 H1 H4 und D1 (neueste Version Sie SELECT Ihre eigenen 5 Zeitrahmen von M1 bis D1)
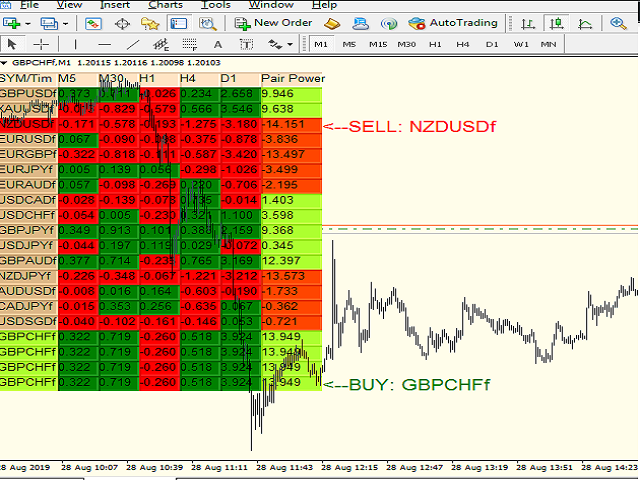
zeigt die STRON G Paar unter allen 20 Paaren in GRÜN
zeigt das schwächerePaar unter allen 20 Paaren in ROT an
VERWENDEN SIE ES AUF jedem Chart TimeFrame
Die Signale erscheinen bei jedem neuen Candle-Tick
STRATEGIE1: KAUF DES STÄRKEREN PAARES / VERKAUF DES SCHWÄCHEREN PAARES
STRATEGIE2: KAUFEN Sie ein stärkeres Paar, wenn der M5-Wert von Rot auf Grün wechselt.
SELL WEAKER PAIR When M5 value turns from Green to Red
WICHTIGE HINWEISE:
1- VERGEWISSERN SIE SICH, DASS SIE DAS RICHTIGE SYMBOL EINGEBEN, SONST BLEIBT DER INDIKATOR STEHEN
2- Vergewissern Sie sich, dass Sie die M1/M5/M15/M30/H1/H4/D1 Datenhistorie für die ausgewählten Symbole haben, damit der Indikator korrekt berechnet werden kann.

Working great. Great 'signals', i use it one time a day with a kind of basket trading and i made good profits the whole week. Maybe due the big drop on US30 and NAS100.