Moving Support Resistance Levels
- Indikatoren
- Version: 1.20
- Aktualisiert: 13 Februar 2020
- Aktivierungen: 5

Simple 3 Bewegliche Unterstützungen und Widerstandsniveaus
(Ihre Bewertung/Kommentar und Feedback ist wichtig! Danke)
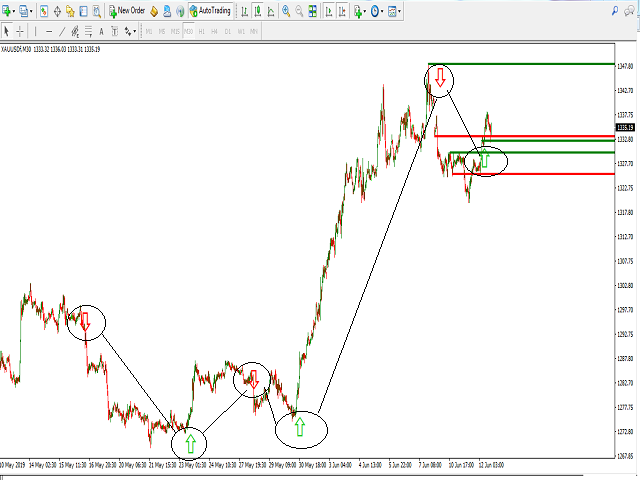
Signal UP und Down Möglichkeiten bei Überschreiten der Multi Supports/Resistance Levels erstellt
unterstützt alle Zeitrahmen
Angepasste Eingaben für den abgedeckten Bereich, um die Levels zu generieren und die Verschiebungen, die nötig sind, um die 3 Unterstützungs-/Widerstandsebenen abzudecken
zum Beispiel können Sie die Hauptparameter in M30-Zeitrahmen verwenden:
extern int ShiftFromStart=20;
extern int barsCount=20;
extern int sequenceShifts=50;
Eingabe int TrendMovingPeriod =50;
UP DOWN Pfeile für mögliche BUY/SELL Möglichkeiten werden gesetzt
Der Benutzer hat keinen Kommentar hinterlassen