PowerMeter Currencies Table1
- インディケータ
- バージョン: 4.51
- アップデート済み: 11 9月 2020
- アクティベーション: 5

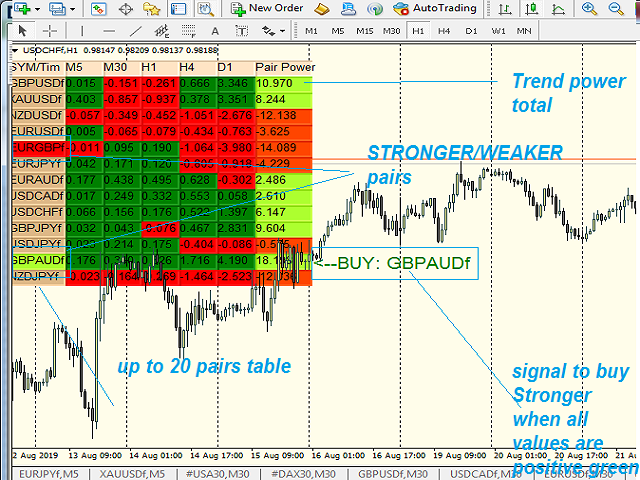
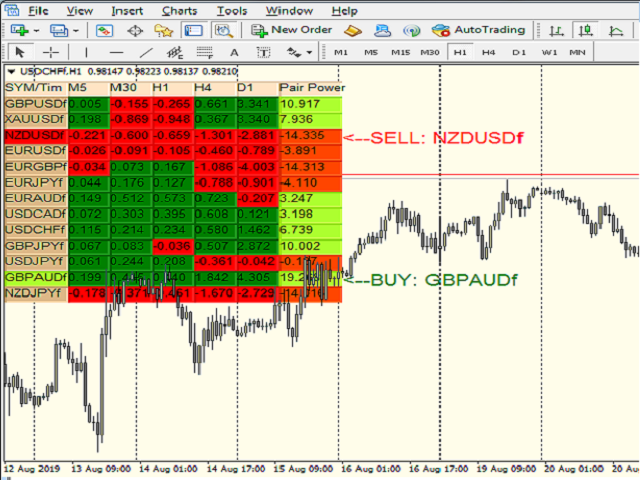
SYMBOL POWER based on inputted 5 time frames and Compared to 20 Other Symbols !! Great Indicator
YOU DON'T HAVE TO SHIFT ON ALL TIME FRAMES FOR EACH CURRENCY PAIR TO CONCLUDE ITS TREND AND ITS POWER
YOU HAVE IT ALL IN ONE TABLE , 20 CURRENCY PAIR WITH 5 TIME FRAMES
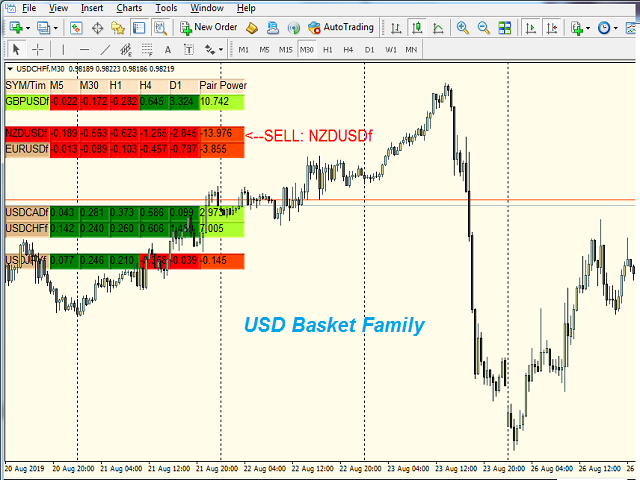
ALSO , COMPARE BETWEEN CURRENCIES STRENGTH
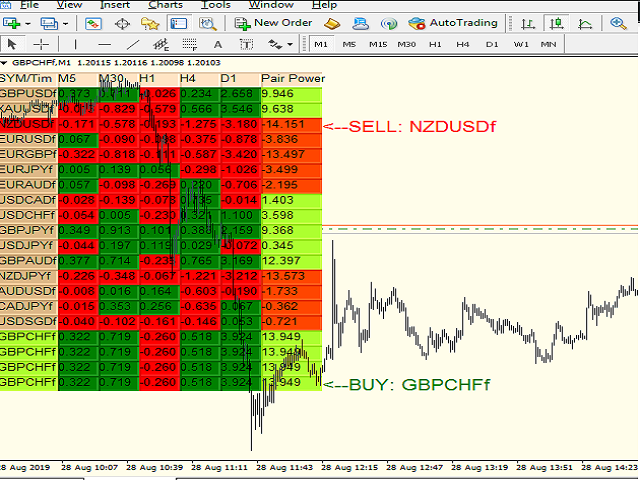
AND ALERTS THE STRONGER /WEAKER PAIR BASED ON 5 TIMEFRAMES CALCULATIONS
ALEERTS enable /disable
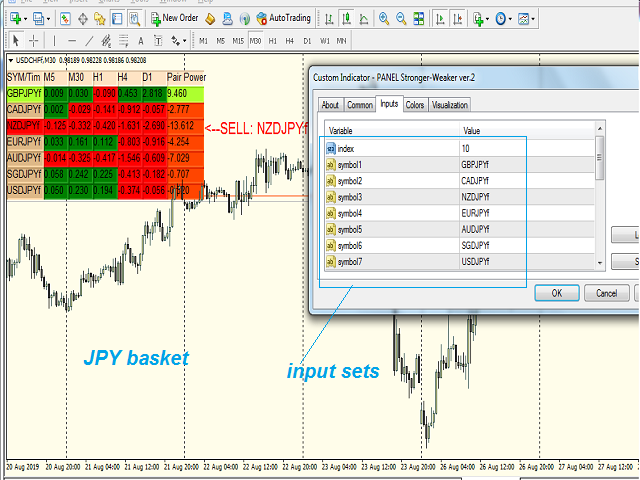
using 5 time frames M5 M30 H1 H4 and D1 (latest version You SELECT you own 5 timeframes from M1 to D1)
shows the STRONG pair among all 20 pairs in GREEN
shows the WEAKER pair among all 20 pairs in RED
USE IT ON any chart TimeFrame
Signals will occur on new Candle tick
STRATEGY1: BUY STRONGER PAIR / SELL WEAKER PAIR
STRATEGY2: BUY STRONGER PAIR When M5 value turns from Red to Green
SELL WEAKER PAIR When M5 value turns from Green to Red
IMPORTANT NOTES:
1- BE SURE YOU ENTER CORRECT SYMBOL OR INDICATOR WILL STOP
2- BE SURE YOU HAVE M1/M5/M15/M30/H1/H4/D1 DATA HISTORY for selected symbols enough for correct indicator calculations

Working great. Great 'signals', i use it one time a day with a kind of basket trading and i made good profits the whole week. Maybe due the big drop on US30 and NAS100.