Trend Lines Signals1
- Indikatoren
- Version: 1.51
- Aktualisiert: 11 März 2022
- Aktivierungen: 5

Trendlinien Signal
Dieser Indikator liefert Kauf-/Verkaufssignale, die auf Berechnungen auf dem höheren Frame (Trend) und dem unteren Frame (Einstiegssignale) basieren.
* Sie sollten den höheren und unteren Frame für die Berechnungen des Indikators auswählen.
* Sie können die Farben der Trendlinien nach Belieben auswählen.
* Aktivieren oder deaktivieren Sie Alarme!
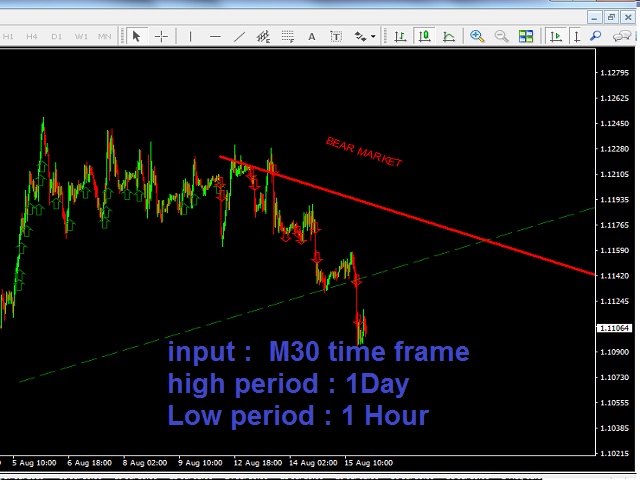
Trendlinien UP/Down werden gezeichnet, wenn ein Trend erkannt wird
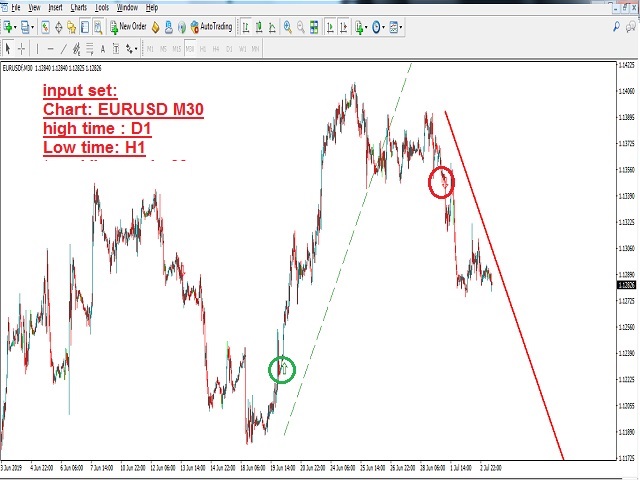
Warten Sie auf kleine Pfeile für den Einstieg:
*Normalerweise ist ein Pfeil nach oben in einem Aufwärtstrend ein KAUFsignal:
---Sie schließen die KAUF-Position, wenn ein umgekehrtes DOWN-Trendsignal erscheint oder wenn die Up-Trendlinie nach unten gekreuzt wird
*Normalerweise ist ein DOWN-Pfeil in einem DOWN-Trend ein SELL-Signal:
---Sie schließen die SELL-Position, WENN ein Reverse UP Trend Signal erscheint oder wenn die DOWN Trendlinie nach oben gekreuzt wird
meine vorgeschlagenen Eingabeparameter :
M30 Chart ::::: Hoher Zeitrahmen : D1 Niedriger Zeitrahmen : H1
M1 Chart ::::: Hoher Zeitrahmen : H1 Niedriger Zeitrahmen : M5

Der Benutzer hat keinen Kommentar hinterlassen