PowerMeter Currencies Table
- Indikatoren
- Version: 3.0
- Aktualisiert: 12 November 2019
- Aktivierungen: 5

SIE MÜSSEN NICHT ALLE ZEITRAHMEN FÜR JEDES WÄHRUNGSPAAR VERSCHIEBEN, UM SEINEN TREND UND SEINE STÄRKE ZU ERKENNEN
SIE HABEN ALLES IN EINER TABELLE, 20 WÄHRUNGSPAARE MIT 5 ZEITRAHMEN
VERGLEICHEN SIE AUCH DIE STÄRKE DER EINZELNEN WÄHRUNGEN
UND WARNT DAS STÄRKERE/SCHWÄCHERE PAAR AUF DER GRUNDLAGE VON 5 ZEITRAHMEN-BERECHNUNGEN
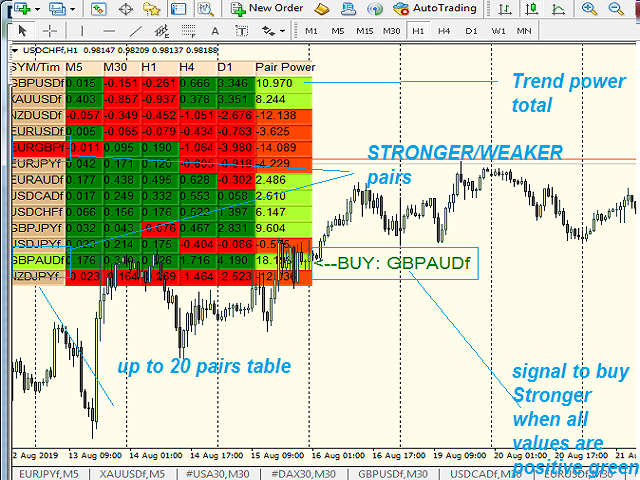
Die Power-Meter-Währungstabelle ist ein sehr hilfreiches Werkzeug, um die TREND-Stärke von bis zu 20 Währungspaaren anzuzeigen
unter Verwendung von 5 Zeitrahmen M5 M30 H1 H4 und D1(neueste Version Sie wählen Ihre eigenen 5 Zeitrahmen von M1 bis D1 aus)
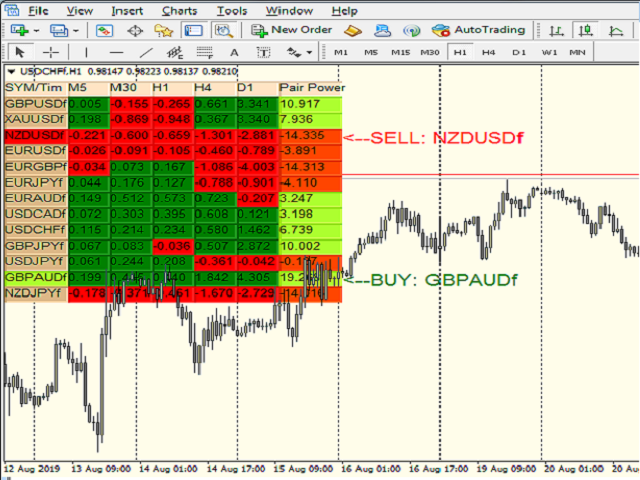
die Power Table zeigt die STRONG Paar unter allen 20 Paaren in GRÜN
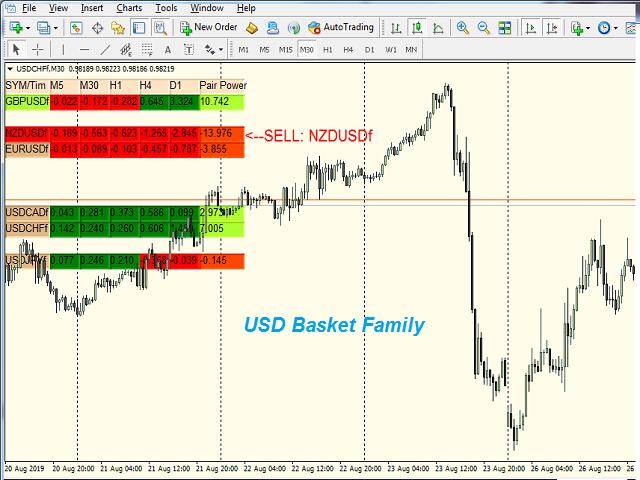
die Power Table zeigt das schwächere Paar unter allen 20 Paaren in ROTan
Ein Hinweisschild " BUY pair " wird mit dem berechneten STRONGER pair angezeigt
Ein Beratungsetikett "SELL pair" wird mit dem berechneten WEAKER pair angezeigt
Klicken Sie auf das Symbol, um das entsprechende Diagramm zu öffnen und zu handeln
Klicken Sie auf die Beratungsetiketten KAUFEN/VERKAUFEN, um den entsprechenden Symbolchart zu öffnen und zu handeln
wenn alle Zellenwerte in einer Zeile für ein Paar ROT sind --> zeigt einen sehr BÄREN Trend an
wenn alle Zellenwerte in einer Reihe für ein Paar in GRÜN sind-->zeigt einen sehr BULL-Trend an
USE IT ON any chart TimeFrame
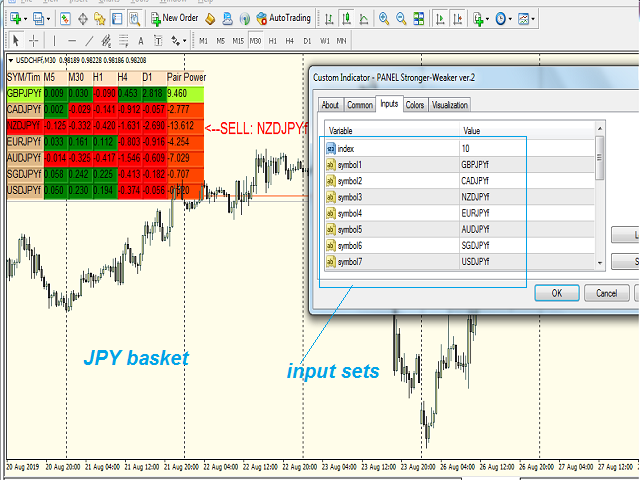
Eingaben: 1- Powerindex : 5/ 10/20/30.... (Ich verwende 30 !)
bis zu 20 Paare ( Sie können 2,3,5,....20 vergleichen : aber jedes falsche Paar wird den Indikator STOPPEN - lassen Sie unerwünschte Symbole leer "")
2- Bis zu 20 verschiedene Symbolpaare
3- 5 Eingabezeitrahmen
HINWEIS ::: LEERE Symbole werden als Hauptchart-Symbol betrachtet (Programmierarbeiten zu diesem Thema)
STRATEGIE1: STÄRKERES PAAR KAUFEN / SCHWÄCHERES PAAR VERKAUFEN
STRATEGIE2: KAUFEN Sie ein stärkeres Paar, wenn der M5-Wert von Rot auf Grün wechselt.
SELL WEAKER PAIR When M5 value turns from Green to Red
SCHLIESSEN KAUFEN Handel eröffnen wenn die Farbe des unteren Zeitrahmens M5/M1 und M5/M15/M30 ROT wird, mit Ausnahme von H1 H4 D1 (GRÜN)
CLOSE open SELL Handel wenn die Farbe des unteren Zeitrahmens M5/M1 und M5/M15/M30 GRÜN wird, außer H1 H4 D1 (ROT)
Sie können Ihre bevorzugte Strategie entsprechend Ihren Eingaben und den bisherigen Handelsergebnissen einrichten.
WICHTIGE HINWEISE:
1- VERGEWISSERN SIE SICH, DASS SIE DAS RICHTIGE SYMBOL EINGEBEN, SONST WIRD DER INDIKATOR ANHALTEN
2- Vergewissern Sie sich, dass Sie M1/M5/M15/M30/H1/H4/D1 DATA HISTORY für die ausgewählten Symbole haben, damit der Indikator korrekt berechnet werden kann.