Smooth Deviation Line 2 Symbols
- Indikatoren
- Version: 1.58
- Aktualisiert: 27 Mai 2020
- Aktivierungen: 5

SMOOTH DEVIATION Linienanzeige für 2 Symbole
Es vergleicht die Kraft/Stärke-Linien von zwei vom Benutzer eingegebenen Symbolen und erstellt eine GESCHWUNGENE Linie, die den Grad der Abweichung der 2 Symbole anzeigt
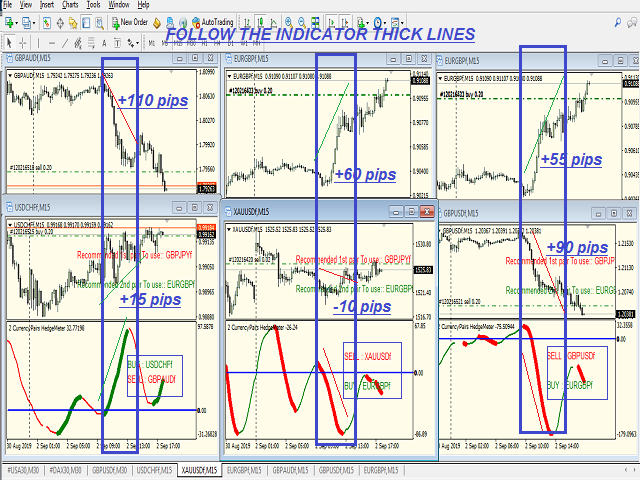
Strategy#1- FOLLOW THE INDICATOR THICK LINE when CROSSING O LEVEL DOWN --- TRADE ON INDICATOR THICK LINE (TREND FRIENDLY) !!
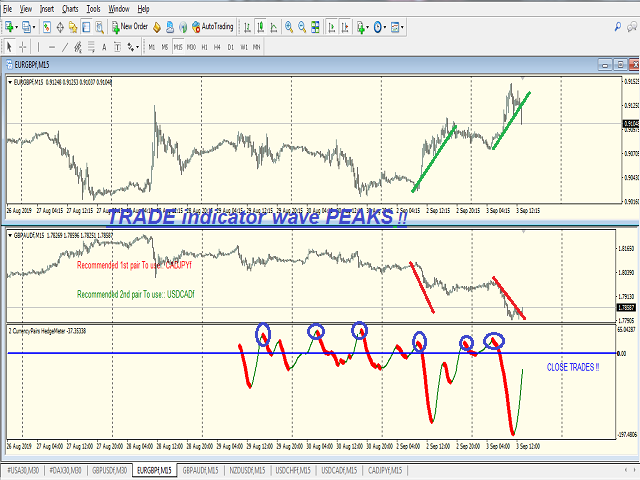
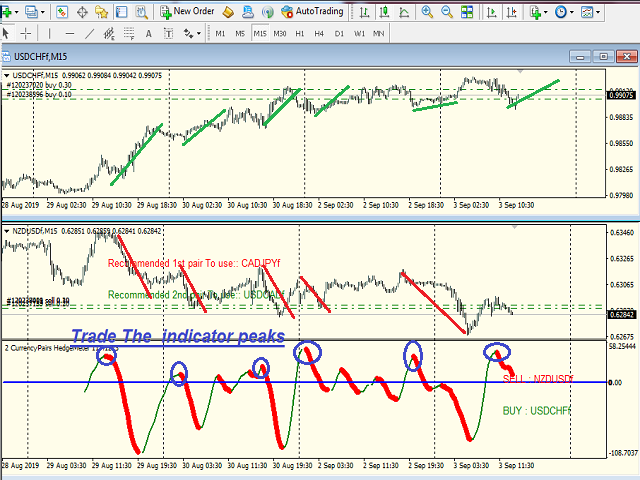
Strategie#2- TRADE INDICATOR PEAKS (Folge dem Indikator Reversal PEAKS Levels) !!
Sie Eingabe - der Index der Berechnung ( 10/20/30....)
- der Indikator Drawing Startpunkt (Indikator Geschichte in Bars gezeichnet)
- die beiden zu vergleichenden Symbole ( geben Sie Ihre Symbole sorgfältig ein, da das Format bei verschiedenen Brokern unterschiedlich sein kann)
- Liste der Symbole, die verwendet werden, um ein vorgeschlagenes Paar von zwei abweichenden Währungen zu generieren, das für die Absicherung als Ihre 2 Eingangssymbole für bessere Absicherungsergebnisse verwendet wird
Funktioniert mit jedem TIMEFRAME
:::: geben Sie Ihre Symbole sorgfältig ein, da sich das Format zwischen verschiedenen Brokern unterscheiden kann
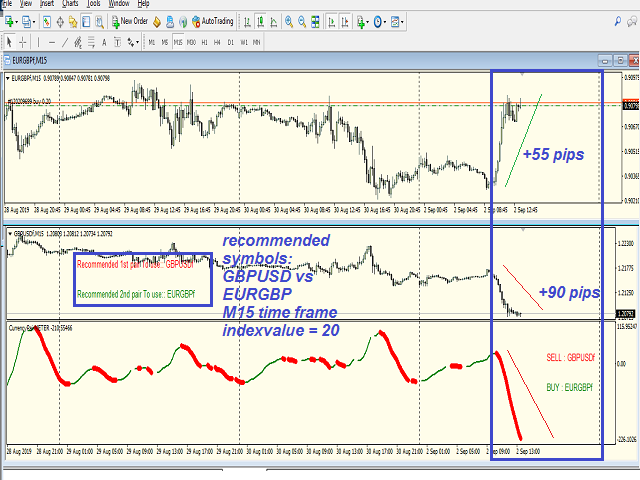
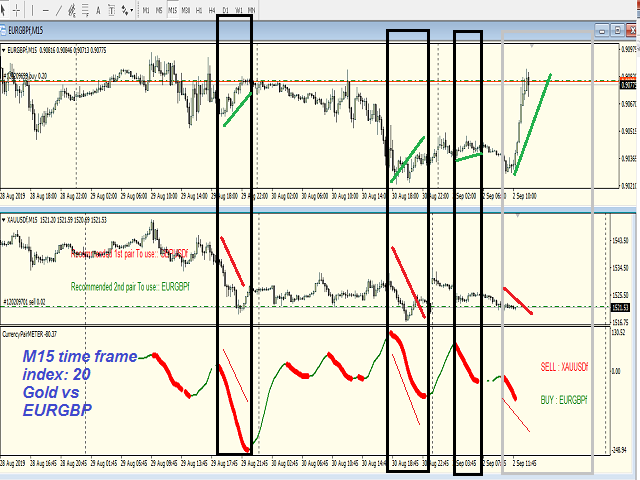
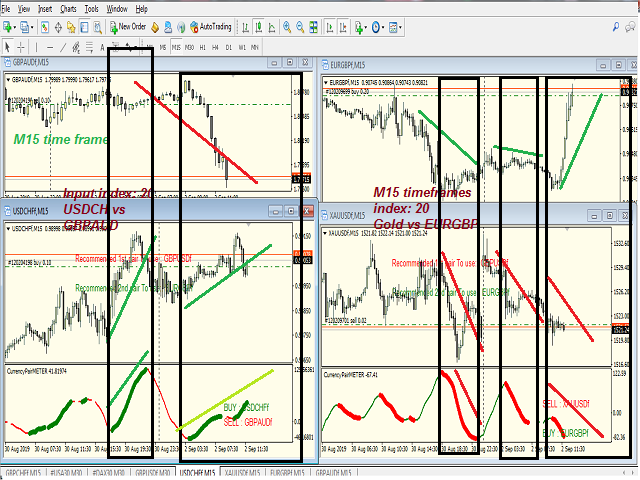
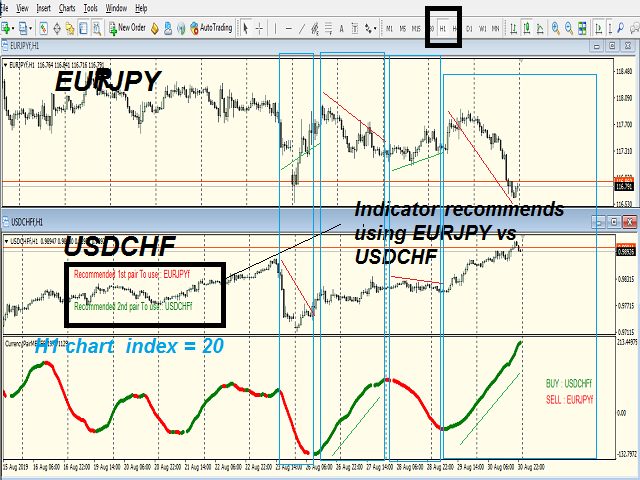
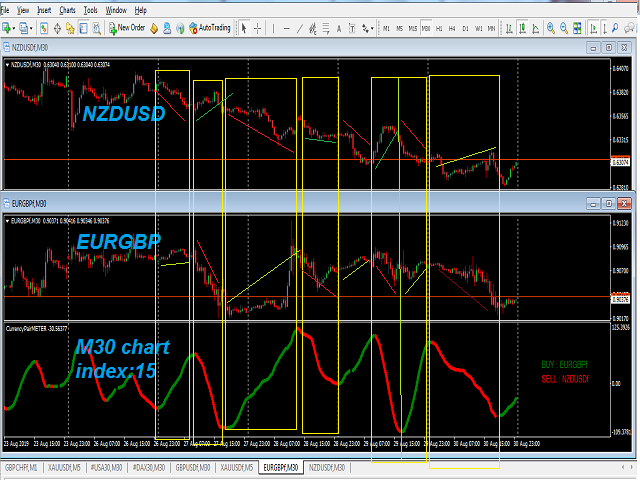
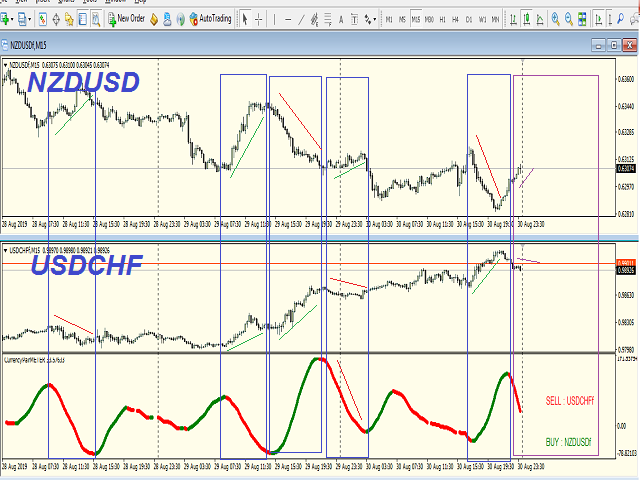
Die vorgeschlagenen 2 Währungspaare erscheinen im Hauptfenster des Charts, um sie in Ihrem Input-Set zu verwenden
FOLGEN SIE DER DICKEN LINIE DES INDIKATORS --- HANDELN SIE AUF DER DICKEN LINIE DES INDIKATORS !!
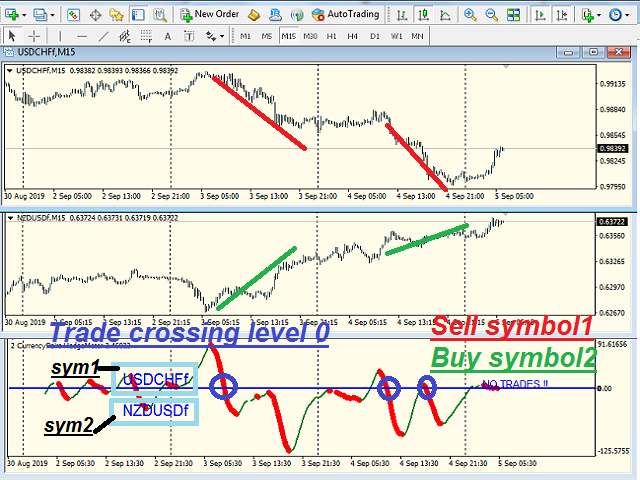
wenn die Indikator-Linie nach unten geht (ROTE DICKE LINIE : MIT DEM TREND && Linie kreuzt Level 0 ) zeigt an, dass Symbol2 die Macht über Symbol1 übernimmt ==> SYMBOL1 VERKAUFEN + SYMBOL2 KAUFEN
wenn die INDICATOR-Linie nach oben geht (GRÜNE dünne LINIE : Gegen den TREND ) ==> SYMBOL1 VERKAUFEN und SYMBOL2 KAUFEN SCHLIESSEN
wenn die INDICATOR-Linie nach oben geht (GRÜNE DICKE MIT DEM TREND && Linie kreuzt Level 0 ) zeigt an, dass Symbol1 die Macht über Symbol2 übernimmt==> KAUFEN SYMBOL1 + VERKAUFEN SYMBOL2
wenn die INDICATOR-Linie nach unten geht (ROTE dünne LINIE : Gegen den TREND ) ==> KAUF SYMBOL1 SCHLIESSEN und VERKAUF SYMBOL2 SCHLIESSEN
::::Ich empfehle nicht, auf einer dünnen Linie zu arbeiten (gegen den TREND)
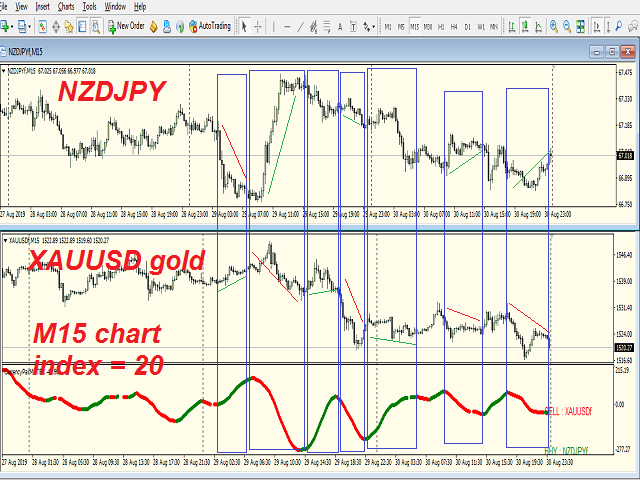
ODER MIT INDIKATORSPITZEN ZU HANDELN:
- Finden Sie Peak-Levels auf Indikator-Wellen und Handel auf Umkehrung Symbols1 vs Symbol2 (Beispiel gezeigt, in screeshots beigefügt)
Strategie #3: Täglicher Handel auf dicke Linien:
A- Rote (grüne) dicke Linie erscheint nach grüner (roter) dünner Linie : Alarm aktiviert, um Symbol1 zu verkaufen (kaufen) und Symbol2 zu kaufen (verkaufen)
B - im Laufe des Tages erscheint eine weitere rote (grüne) dicke Linie nach der grünen (roten) dünnen Linie: Alarm aktiviert, um Symbol1 zu verkaufen (kaufen) und Symbol2 zu kaufen (verkaufen) - neue Positionen mit demselben Lot hinzufügen
C - Am Ende des Tages: Prüfen Sie, ob alle Positionen im Gewinn sind (Sie können Ihren Gewinn im Verhältnis zu Ihrer eingesetzten Marge festlegen): Schließen Sie Ihre Positionen für heute
D - Am Ende des Tages: Prüfen Sie, ob die Gesamtpositionen nicht profitabel sind (Sie können Ihren Gewinn im Verhältnis zu Ihrer verwendeten Marge festlegen):
Wiederholen Sie Schritt A-D für den nächsten Tag
F- Wenn sich die dicken Linien in Grün (Rot) umkehren: Fügen Sie 2 neue Positionen in verschiedenen Richtungen hinzu (Kaufen (Verkaufen) Symbol1 und Verkaufen (Kaufen) Symbol2) und schließen Sie zwei Positionen des alten Trends
und wiederholen Sie A-F
ALERTS für das Überschreiten des Levels 0 oder die Umkehrung des Peaks werden bereitgestellt
TESTEN SIE DIE DEMO VOR JEDEM KAUF!