Elliot 1to5 pattern Signal
- Indikatoren
- Version: 3.21
- Aktualisiert: 1 September 2019
- Aktivierungen: 5

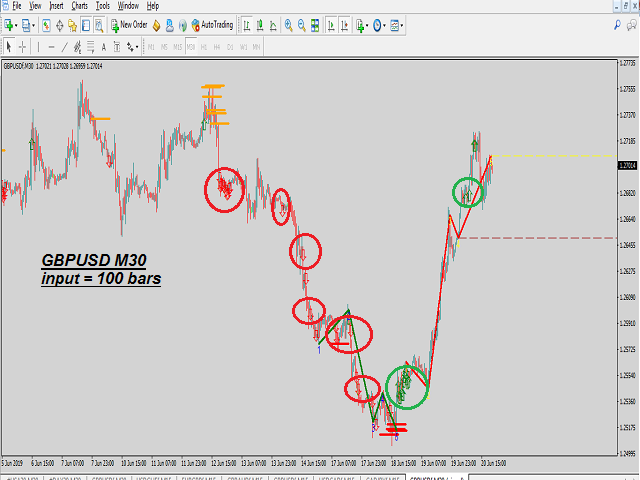
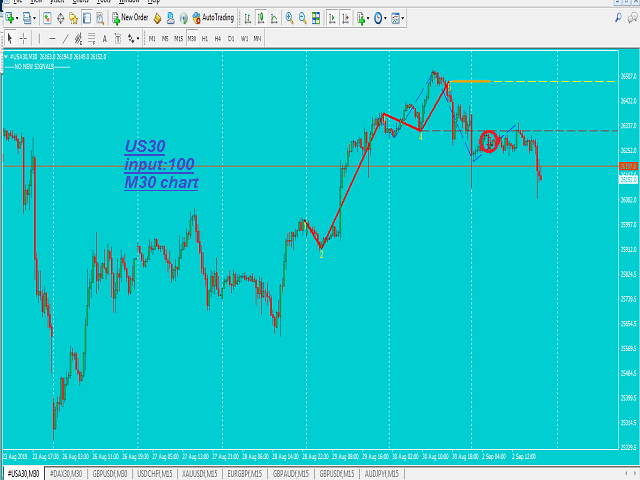
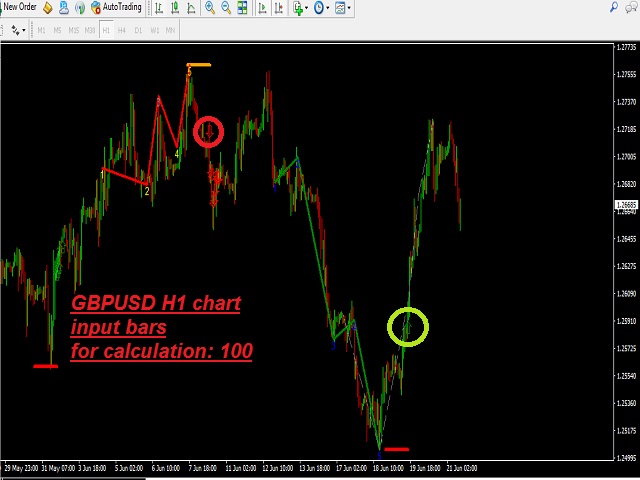
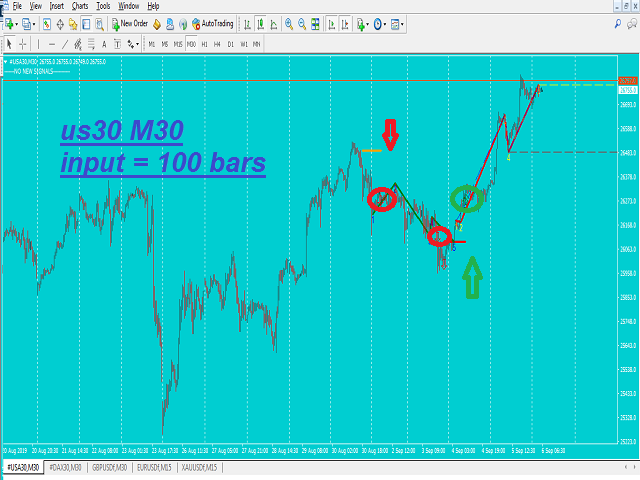
Eine einfache Herangehensweise an Elliot-Wellen-Muster
Das Signal wird bei Trendfortsetzung generiert, wenn das "5"-Niveau durchbrochen wird, oder bei Korrekturen nach 1-5 erkannten Wellen
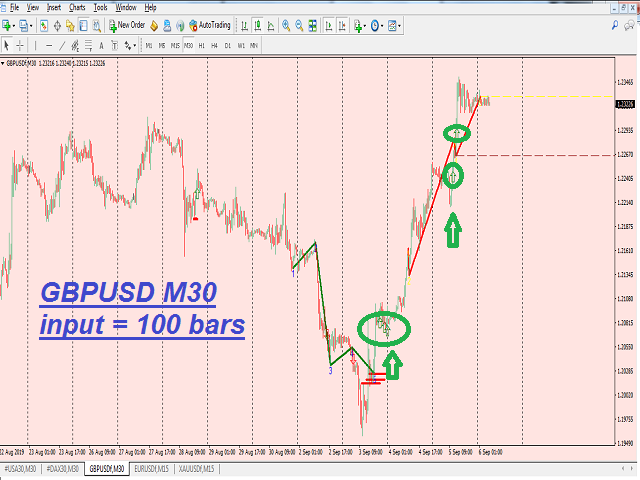
1-5 beschriftete Punkte
Pfeile werden für das Signal UP/DOWN Richtung verwendet
Chaotische Muster in Blau werden immer gezeichnet, bis ein 1-5 Elliot-Wellenmuster erkannt wird
1-5 Rotes Muster im Bullenmarkt: Pfeil nach OBEN bei Fortsetzung des BULL-Trends ODER Pfeil nach UNTEN bei einer Umkehr in Richtung UNTEN als Korrektur des Musters
1-5 Grünes Muster im Bärenmarkt: Pfeil nach unten bei Fortsetzung des BÄR-Trends ODER Pfeil nach oben als Umkehrung nach oben als Musterkorrektur
-->> Die Anzahl der eingegebenen Balken und der ausgewählte Zeitrahmen werden verwendet, um Ihre eigene Strategie zu erstellen.