PowerMeter Currencies Table1
- Indicadores
- Versión: 4.51
- Actualizado: 11 septiembre 2020
- Activaciones: 5

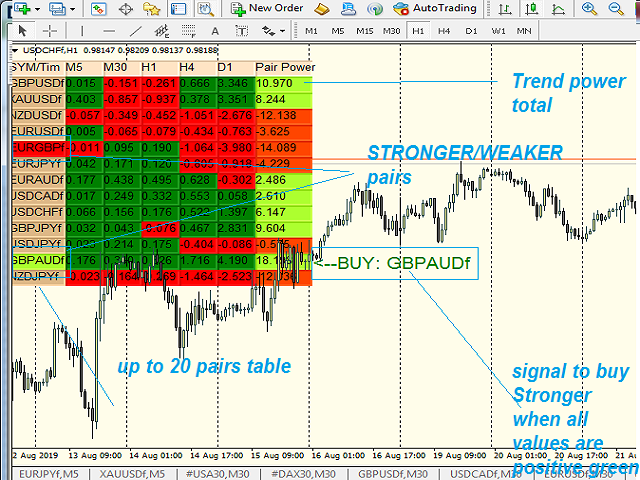
¡¡POTENCIA SÍMBOLO basado en inputted 5 marcos de tiempo y en comparación con 20 Otros Símbolos !! Gran Indicador
USTED NO TIENE QUE CAMBIAR EN TODOS LOS MARCOS DE TIEMPO PARA CADA PAR DE DIVISAS PARA CONCLUIR SU TENDENCIA Y SU PODER
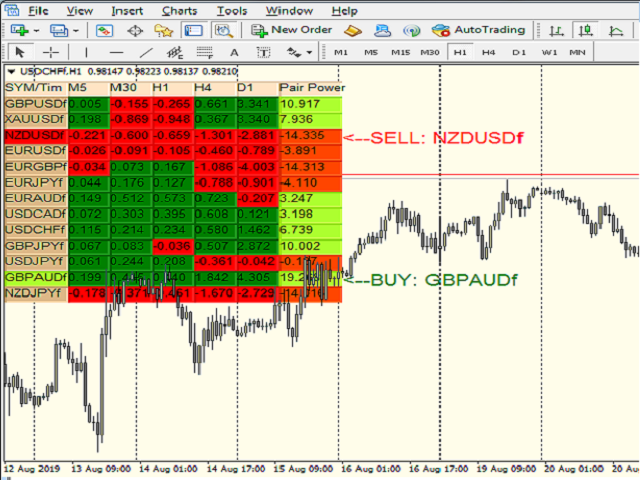
USTED TIENE TODO EN UNA TABLA, 20 PARES DE DIVISAS CON 5 MARCOS DE TIEMPO
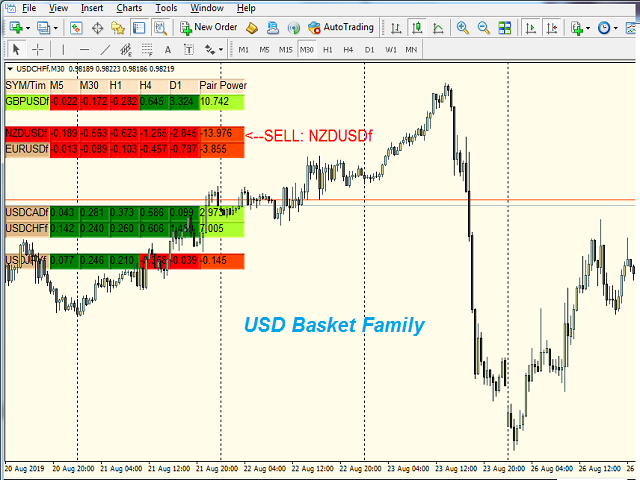
TAMBIÉN, COMPARAR ENTRE LA FUERZA DE DIVISAS
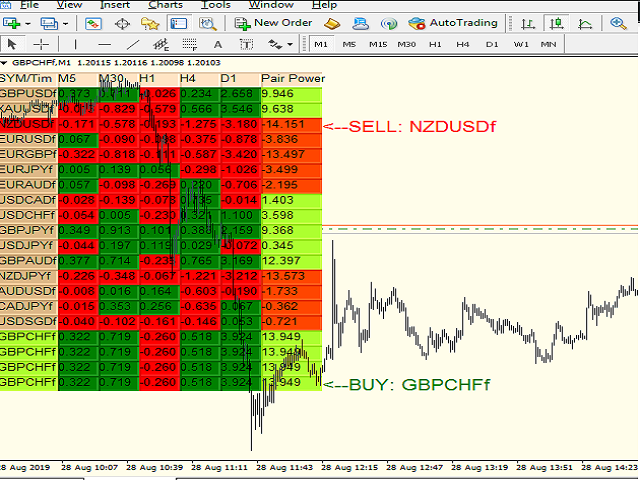
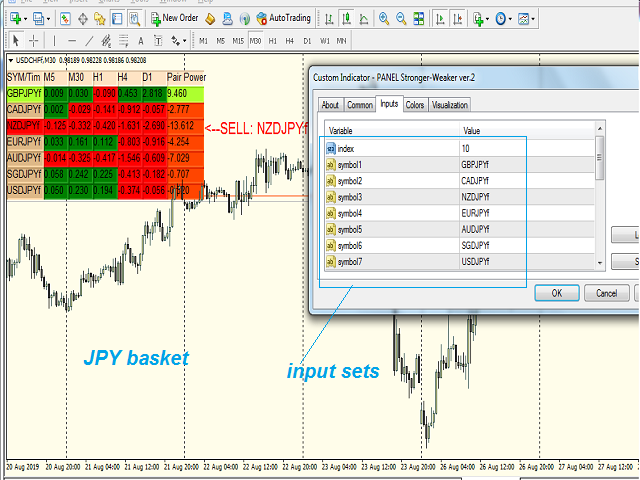
Y ALERTAS EL PAR MÁS FUERTE / MÁS DÉBIL BASADO EN CÁLCULOS DE 5 MARCOS DE TIEMPO
ALEERTS activar / desactivar
utilizando 5 marcos de tiempo M5 M30 H1 H4 y D1 (última versión SELECCIONE usted mismo 5 marcos de tiempo de M1 a D1)
muestra la FUERT E entre los 20 pares en VERDE
muestra el parDEBILentre los 20 pares en ROJO
USAR EN CUALQUIER gráfico TimeFrame
Las señales ocurrirán en el nuevo tick de la vela
ESTRATEGIA1: COMPRAR EL PAR MÁS FUERTE / VENDER EL PAR MÁS DÉBIL
ESTRATEGIA2: COMPRAR PAR MÁS FUERTE Cuando el valor M5 pasa de Rojo a Verde
VENDER PAR DÉBIL Cuando el valor M5 cambia de Verde a Rojo
NOTAS IMPORTANTES:
1- ASEGÚRESE DE INTRODUCIR EL SÍMBOLO CORRECTO O EL INDICADOR SE DETENDRÁ
2- ASEGÚRESE DE TENER UN HISTORIAL DE DATOS M1/M5/M15/M30/H1/H4/D1 de los símbolos seleccionados suficiente para el cálculo correcto del indicador.

Working great. Great 'signals', i use it one time a day with a kind of basket trading and i made good profits the whole week. Maybe due the big drop on US30 and NAS100.