Currencies Strength Meter and Deviation
- Indikatoren
- Version: 1.11
- Aktualisiert: 3 September 2019
- Aktivierungen: 5

:::: Es ist so programmiert, dass es auf jedem M5 Chat Fenster funktioniert!
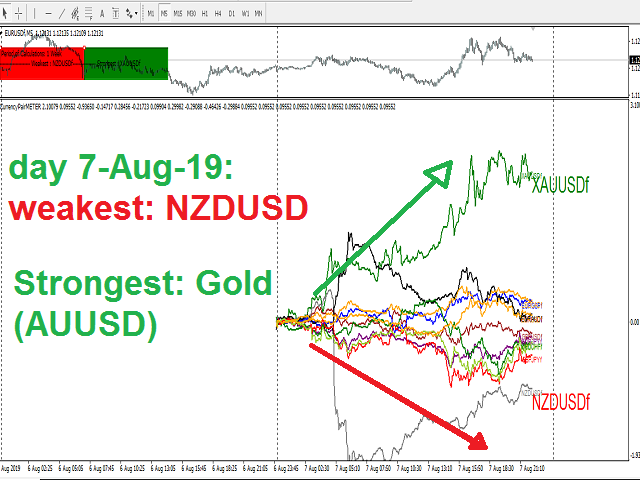
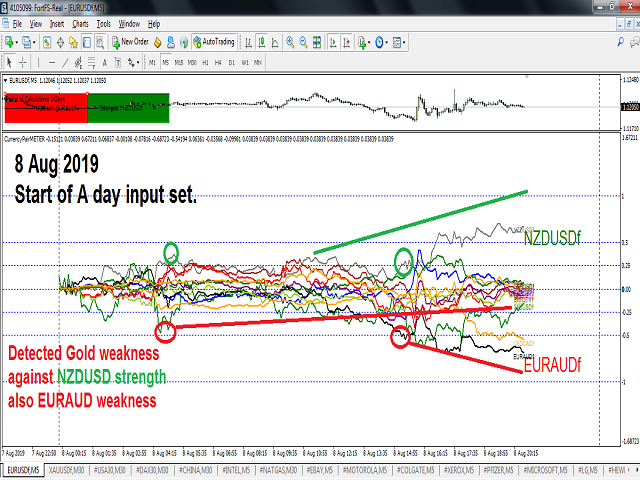
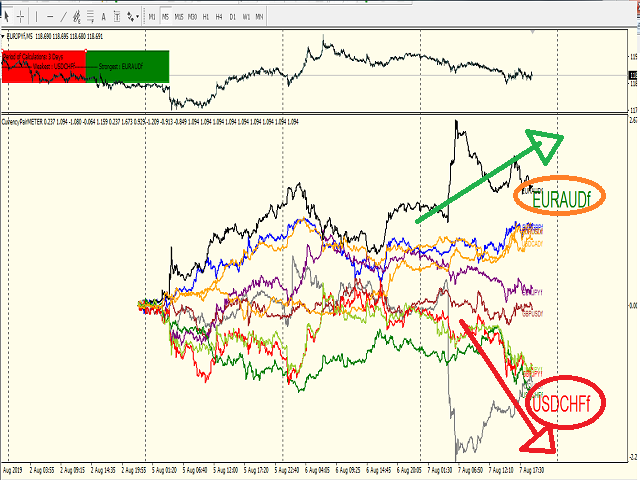
Wird verwendet, um die stärksten und schwächsten Währungspaare zu bestimmen
erkennt auch die Spitze der Abweichung der Währungsstärke
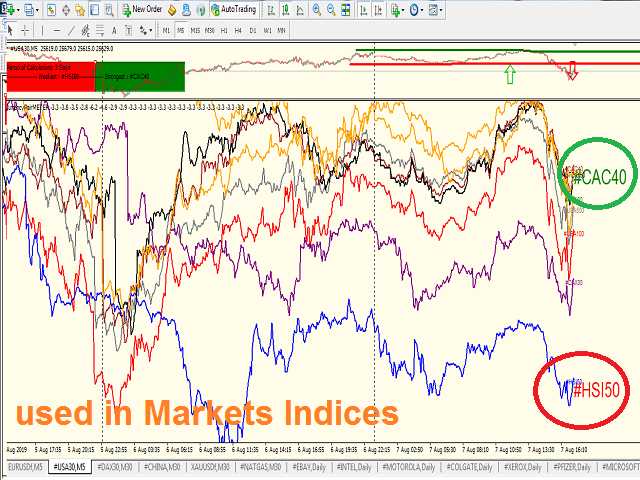
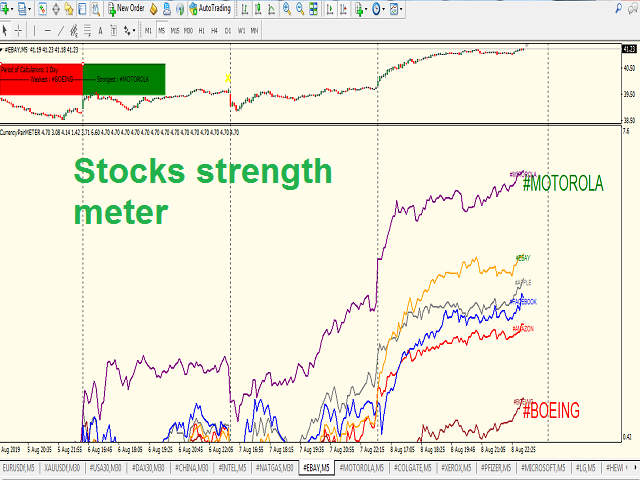
ES KANN AUCH FÜR INDIZES UND AKTIEN VERWENDET WERDEN!
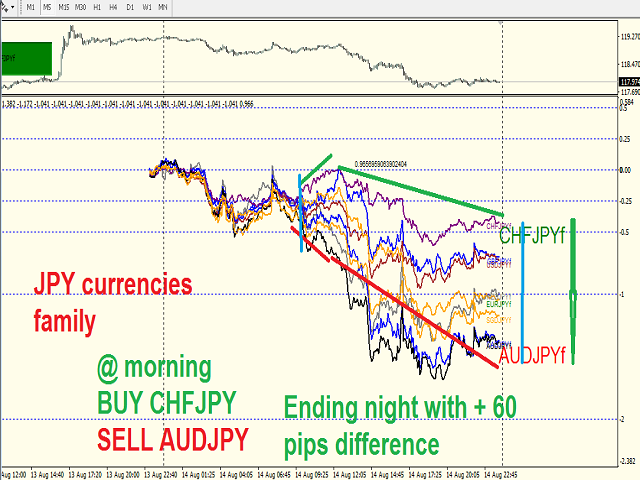
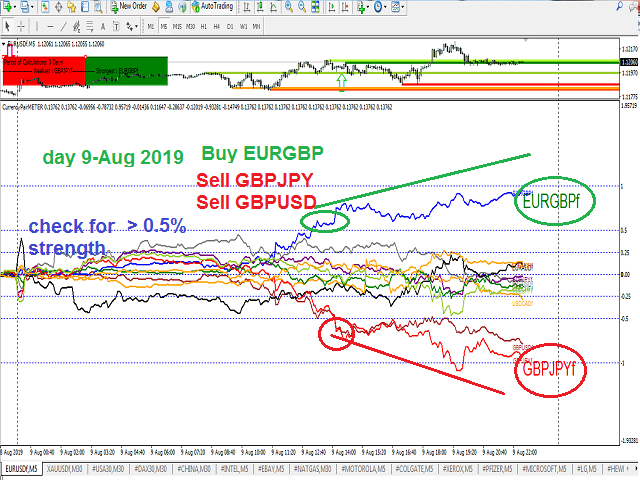
Strategie eins: Sie kann verwendet werden, um das stärkste Paar zu KAUFEN und das schwächste zu VERKAUFEN
Strategie zwei: Es kann auf täglicher Basis verwendet werden, um das stärkste Paar mit einem hohen Prozentsatz (z.B. +1%) zu KAUFEN und das schwächste mit einem niedrigeren Prozentsatz (z.B. -0,7%) zu VERKAUFEN.
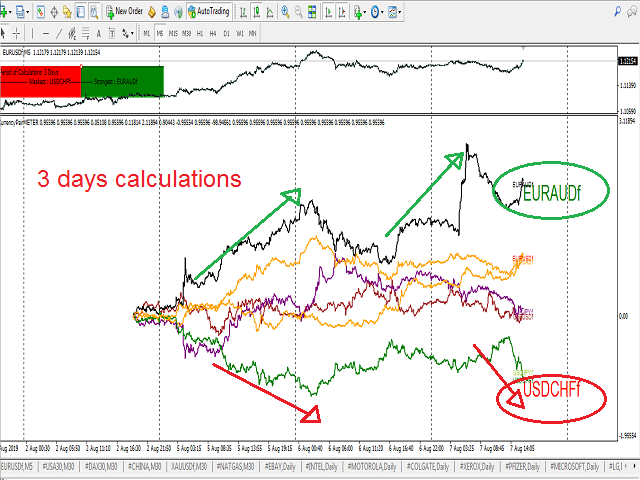
Strategie drei: auf 3 Tage oder mehr Berechnung: Sie können Währungen Stärke Linien kreuzen sich gegenseitig zu erkennen.
WICHTIGER HINWEIS: Dies ist ein mql4-Indikator für mehrere Währungen: er kann also nicht im Strategie-Tester-Modul getestet werden, es sei denn, Sie haben alle ausgewählten Währungen heruntergeladen
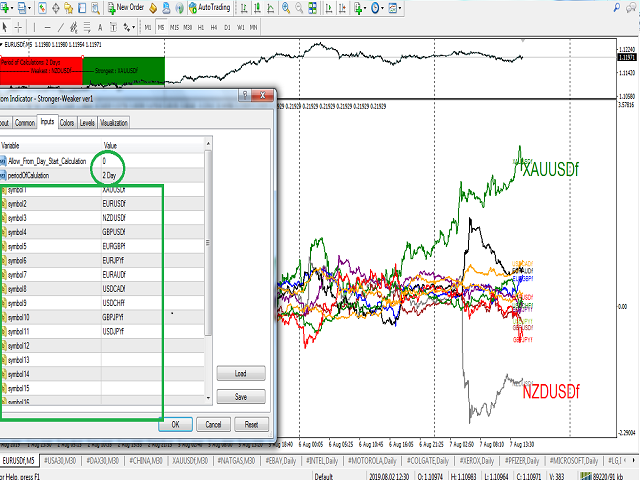
kann bis zu 20 Währungspaare kombinieren
Sie können auf ein beliebiges Symbol in der Grafik klicken, um die Grafik für die Platzierung von Aufträgen zu öffnen
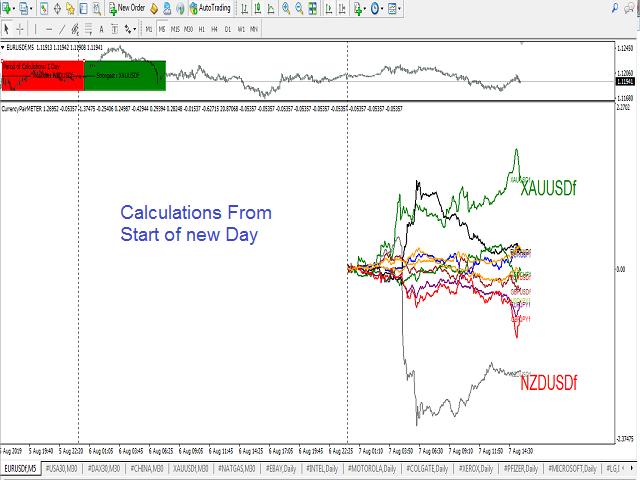
Die Stärkeberechnung funktioniert: vom Beginn eines Tages, 1 Tag, 2 Tage---> 1 Woche
Funktioniert in jedem M5 Chat-Fenster