PowerMeter Currencies Table inChart
- Indikatoren
- Version: 4.5
- Aktivierungen: 5

SYMBOL POWER basiert auf 5 eingegebenen Zeitrahmen und wird mit 20 anderen Symbolen verglichen !! Großartiger Indikator
SIE MÜSSEN NICHT ALLE ZEITRAHMEN FÜR JEDES WÄHRUNGSPAAR DURCHGEHEN, UM DEN TREND UND DIE KRAFT ZU ERKENNEN
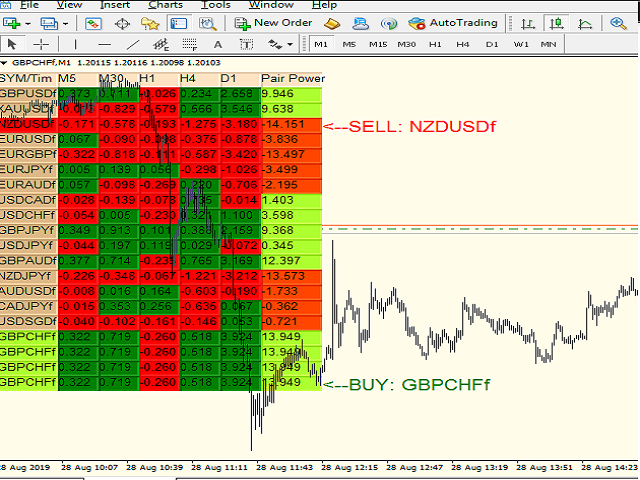
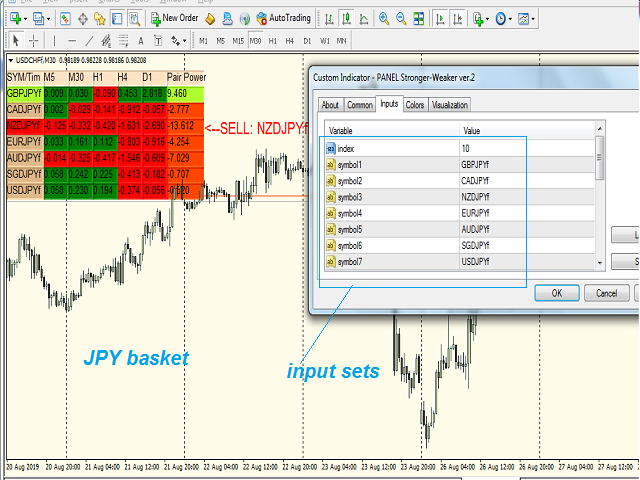
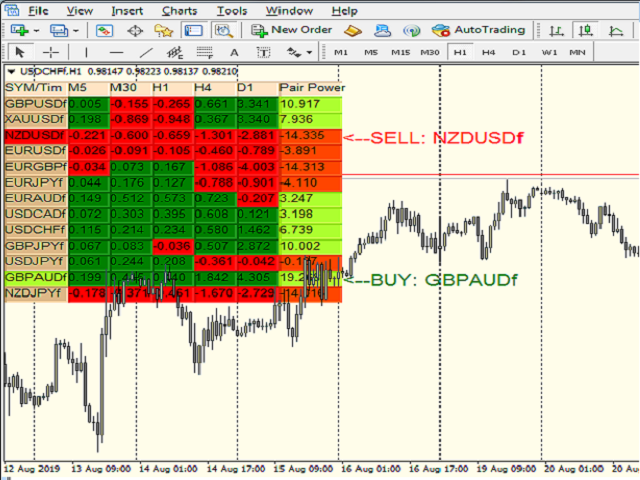
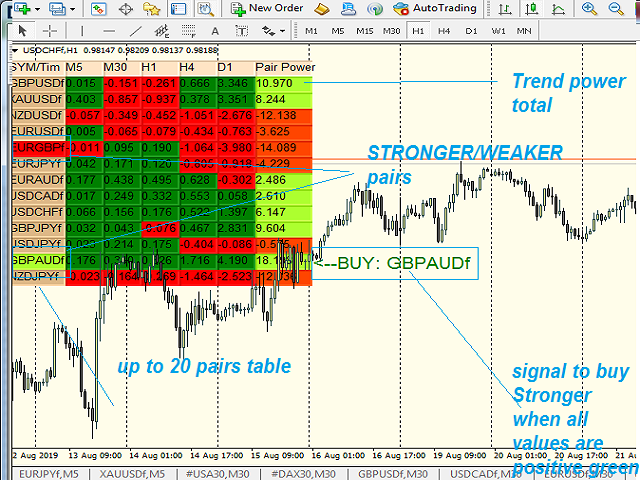
SIE HABEN ALLES IN EINER TABELLE, 20 WÄHRUNGSPAARE MIT 5 ZEITRAHMEN
VERGLEICHEN SIE AUCH DIE STÄRKE DER EINZELNEN WÄHRUNGEN
UND WARNT DAS STÄRKERE/SCHWÄCHERE PAAR BASIEREND AUF 5 ZEITRAHMEN BERECHNUNGEN
ALEERTS aktivieren/deaktivieren
mit 5 Zeitrahmen M5 M30 H1 H4 und D1 (neueste Version Sie wählen Ihre eigenen 5 Zeitrahmen von M1 bis D1 aus)
zeigt das STARKE Paar unter allen 20 Paaren in GRÜN an
zeigt das schwächerePaar unter allen 20 Paaren inROT an
Benutzen Sie es auf jedem Chart TimeFrame
Die Signale erscheinen bei jedem neuen Candle-Tick
STRATEGIE1: KAUF DES STÄRKEREN PAARES / VERKAUF DES SCHWÄCHEREN PAARES
STRATEGIE2: KAUFEN Sie ein stärkeres Paar, wenn der M5-Wert von Rot auf Grün wechselt.
SELL WEAKER PAIR When M5 value turns from Green to Red
WICHTIGE HINWEISE:
1- VERGEWISSERN SIE SICH, DASS SIE DAS RICHTIGE SYMBOL EINGEBEN, SONST BLEIBT DER INDIKATOR STEHEN
2- Vergewissern Sie sich, dass Sie für die ausgewählten Symbole genügend M1/M5/M15/M30/H1/H4/D1-DATENVERLAUF haben, damit der Indikator korrekt berechnet werden kann.
3- ACHTEN SIE DARAUF, DASS SIE ALLE 20 SYMBOLE AUSFÜLLEN (AUCH WIEDERHOLUNGSSYMBOLE), DA LEERE SYMBOLE ZU FALSCHEN SIGNALEN FÜHREN

Der Benutzer hat keinen Kommentar hinterlassen