SuperIndices MT5
- Indikatoren
-
Stanislav Korotky
 Trading is just my hobby. I'm working in IT industry. So developement of experts, indicators, and script is not a problem at all to me. Wide range of technologies are used: MQL4, MQL5, system and applied programming, web-services, neural networks and more.
New: - Version: 1.5
- Aktualisiert: 24 Oktober 2022
- Aktivierungen: 5
Dieser Cluster-Indikator ist die MT5-Version von SuperIndices für MT4. Er ermöglicht die Verarbeitung von gemischten Clustern, in denen Symbole aus verschiedenen Märkten enthalten sein können. Zum Beispiel kann er Forex, Indizes, CFDs und Spot gleichzeitig verarbeiten. Die Anzahl der sichtbaren Linien wurde auf 16 erhöht. Ein interaktives Lineal kann aktiviert werden, um die Stärke der Signale in der Historie zu messen.
Der Indikator erstellt eine Reihe von eingebetteten Cluster-Indikatoren (CCFpExtraIndices) mit sorgfältig ausgewählten Zeiträumen und kombiniert deren Ergebnisse mit Hilfe intelligenter Gewichtungs- und Normalisierungsalgorithmen. Es können bis zu 15 Instrumente angegeben werden.
Die Signale sind: je höher der Ticker/die Währung, desto stärker das Kaufsignal, je niedriger der Ticker/die Währung, desto stärker das Verkaufssignal. Am zuverlässigsten ist der Plan, Aufwärtsbewegungen zu kaufen und Abwärtsbewegungen zu verkaufen.
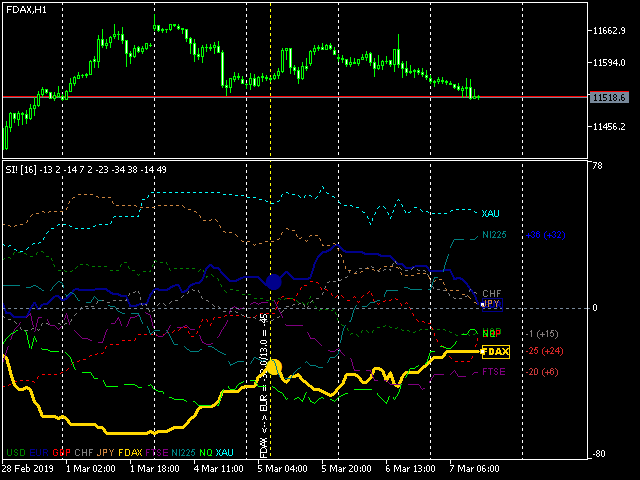
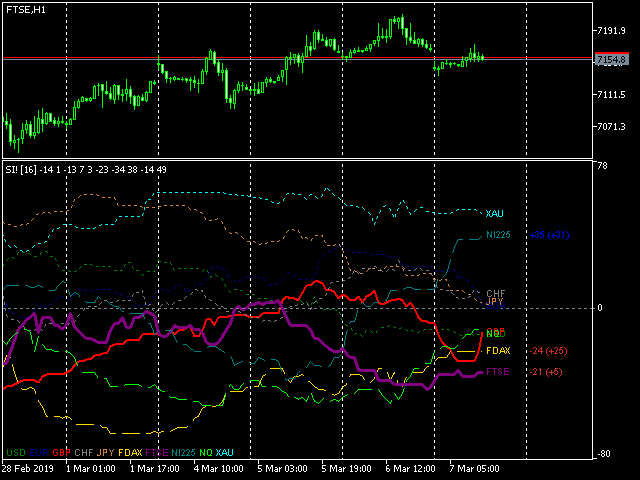
Die Linien eines Tickers und/oder einer Währung, die dem aktuellen Arbeitssymbol entsprechen, sind dick dargestellt. Auf einem DAX30-Chart zum Beispiel ist die dickste Linie der DAX30, etwas weniger dick ist der EUR, da er die Kurswährung des DAX30 ist. Andere Indizes, CFDs und Rohstoffe mit der gleichen Kurswährung werden als dünne, durchgezogene Linien dargestellt (in unserem Fall z.B. STOXX50, CAC40). Andere Indizes, CFDs und Rohstoffe (mit unterschiedlichen Kurswährungen) sind als gestrichelte Linien dargestellt. Alle anderen Währungen sind gepunktete Linien.
Auf der rechten Seite der Linien befinden sich Beschriftungen mit den Namen der Ticker/Währungen und den Signalstärken, die in der Form +-N(+-D) angezeigt werden, wobei N - die Differenz zwischen dem Ticker und seiner Kurswährung, D - die durchschnittliche Veränderung der Stärke im letzten Zeitraum (24 Stunden oder 12 Balken, je nachdem, welcher Wert größer ist). Je größer ein positiver Wert ist, desto heller wird die blaue Farbe verwendet. Je größer ein negativer Wert ist, desto helleres Rot wird verwendet. Die beste Gelegenheit ist, wenn sowohl das Signal als auch seine Änderung die gleiche Richtung haben. Eine Stärke von der Hälfte der Skala oder mehr erhöht die Chancen.
Klicken Sie nacheinander auf 2 Beschriftungen rechts neben den Linien, um das Lineal (vertikale Linie) zu aktivieren. Bewegen Sie den Mauszeiger über die Balken in der Historie, um das Signal zwischen den ausgewählten Markierungen in der Vergangenheit zu sehen (hervorgehoben durch das Lineal). Klicken Sie erneut auf die Markierungen, um das Lineal auszublenden.
Die empfohlenen Zeitrahmen H1 - D1. Erstens erzeugt der Indikator auf höheren Zeitrahmen zuverlässigere Signale. Zweitens verbraucht er auf niedrigeren Zeitebenen viel mehr Ressourcen.
Es wird empfohlen, die Symbole einzeln zu einem Cluster hinzuzufügen - dies vereinfacht das Herunterladen der Daten und macht es einfacher, potenzielle Probleme zu lokalisieren.
Parameter:
- Instrumente - kommaseparierte Liste von Instrumenten, maximal 15; die Instrumente dürfen keine gemeinsame Währung haben - der Indikator wird versuchen, eine Umrechnungsregel über die Standardwährung (DefaultBase, siehe unten) zu finden, indem er die Basiswährung (für Forex-Symbole) und die Kurswährung analysiert; der Standard-Instrumentensatz ist leer, d.h. es gibt nur ein Arbeitssymbol des aktuellen Charts - dieser Modus ist rudimentär und wird nur benötigt, um die automatische Validierung zu bestehen; es wird empfohlen, mit den 5 Forex-Majors EURUSD, GBPUSD, USDJPY, AUDUSD zu beginnen, für die die entsprechenden Indizes NASDAQ, DAX30, FTSE, NIK225, ASX200 normalerweise zur Verfügung gestellt werden (aber ihre Namen variieren von Broker zu Broker und sind in MetaQuotes-Demo überhaupt nicht vorhanden); bearbeiten Sie sie nach Bedarf;
- MA_Methode - Methode des gleitenden Durchschnitts, die Standardeinstellung ist exponentiell;
- Price - Typ des auf den gleitenden Durchschnitt angewendeten Preises; die Voreinstellung ist der offene Preis; es wird empfohlen, ihn in typisch oder gewichtet zu ändern;
- All_Bars - Anzahl der zu berechnenden Balken, Standardwert - 20; 0 bedeutet alle verfügbaren Balken (nicht empfohlen);
- BarByBar - false bedeutet, dass der 0-te Bar bei jedem Tick neu berechnet wird, true (Standard) bedeutet, dass der Bar nur einmal berechnet wird;
- DefaultBase - zu verwendende Währung, standardmäßig USD;
- Prefix, Suffix - optionaler Präfix und Suffix, die in Symbolnamen verwendet werden (falls von Ihrem Broker verwendet); standardmäßig leer;
- Indicator_Prefix - gemeinsamer Präfix für alle Objekte des Indikators, standardmäßig "S2_"; er sollte für jede Instanz des Indikators, die auf demselben Chart angewendet wird, eindeutig sein.


Very good and useful indicator, the signals it generates are fantastic. Of course it is meant to supplement your current strategy, you can't just use it on it's own. Not to mention that the seller is always helpful and willing to update and even add features to his indicators, I have other products from him too. Highly recommend.