KT Volatility Oscillator MT5
- Indikatoren
-
KEENBASE SOFTWARE SOLUTIONS
 Keenbase Trading entwickelt professionelle MetaTrader 4- und MetaTrader 5-Indikatoren sowie Expert Advisors, die Trader dabei unterstützen, fundiertere Handelsentscheidungen zu treffen.
 - Version: 1.2
- Aktualisiert: 26 März 2022
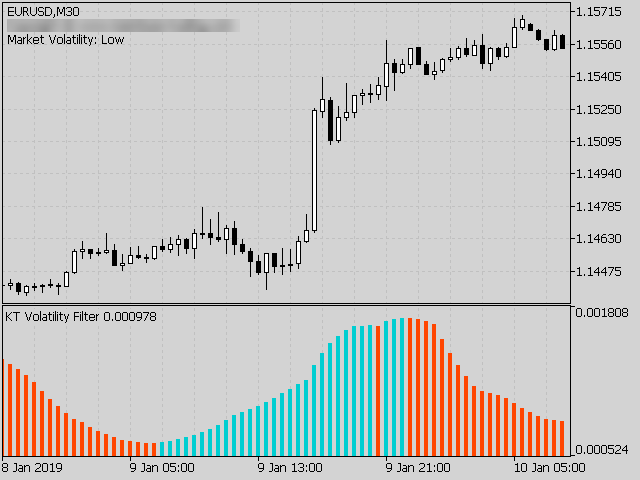
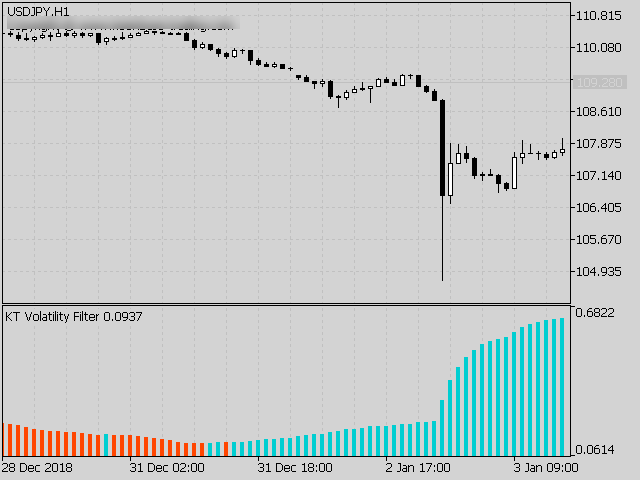
Der KT Volatilitätsoszillator analysiert vergangene und aktuelle Marktdaten mithilfe einer mathematischen Formel und stellt das Ergebnis in Form eines Oszillators dar. Wachsende und abnehmende Wellen entsprechen einer hohen beziehungsweise niedrigen Volatilität des Vermögenswerts.
Kurz gesagt, Volatilität ist ein Maß für die Preisänderungen eines Vermögenswerts über einen bestimmten Zeitraum. Ohne Volatilität gäbe es kaum Bewegungen am Markt und Trader könnten nicht von den Kursbewegungen profitieren.
Einsatz von Volatilität auf dem Forex-Markt
Der gezielte Einsatz von Volatilität auf dem Forex-Markt kann dir helfen, effektiver zu handeln und deine Erwartungen realistischer an den Markt anzupassen.
Hohe Volatilität
- Trendbasierte Handelssysteme funktionieren in volatilen Märkten sehr gut, da größere Schwankungen und längere Positionshaltungen bis zur Trendumkehr auftreten.
- Breakout-Systeme können mehr Pips erzielen, wenn Ausbrüche in Phasen hoher Volatilität stattfinden.
Niedrige Volatilität
- Mean-Reversion-Systeme arbeiten in Zeiten niedriger Volatilität besonders gut, da Märkte dazu neigen, zur Mittelwertlinie zurückzukehren.
- Kanalbasierte Handelssysteme sind während Konsolidierungsphasen mit geringer Volatilität effektiver.
Nicht-richtungsweisender Indikator
Der KT Volatilitätsoszillator ist ein nicht-richtungsweisender Indikator, der nicht direkt mit einer bullischen oder bärischen Marktstimmung korreliert. Steigende Volatilität kann sowohl in Aufwärts- als auch in Abwärtstrends auftreten.
Eingabeparameter
- Volatilitätsperiode: Eine Ganzzahl zur Festlegung des Berechnungszeitraums.
- Textinformationen: Informationen auf dem Chart ein-/ausblenden.
- ----- Alarmeinstellungen -----
- Sound-Alarm: true/false
- Popup-Alarm: true/false
- E-Mail-Alarm: true/false
- Push-Benachrichtigungen: true/false