KT Volatility Oscillator MT5
- Indicadores
-
KEENBASE SOFTWARE SOLUTIONS
 Visite nosso site para acessar ferramentas de trading gratuitas, tutoriais e guias detalhados dos nossos produtos:
https://www.keenbase-trading.com - Versão: 1.2
- Atualizado: 26 março 2022
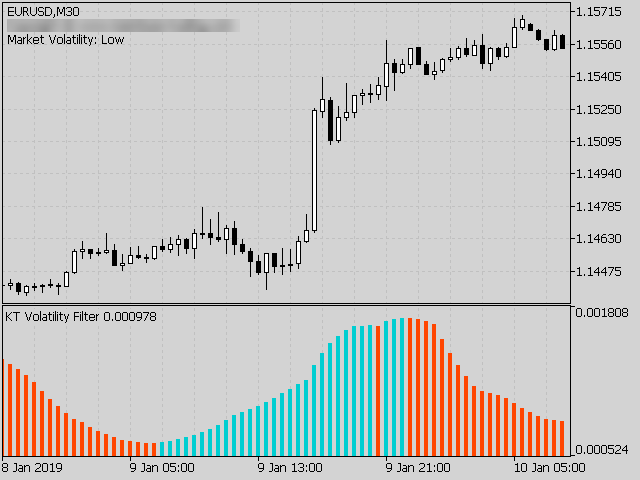
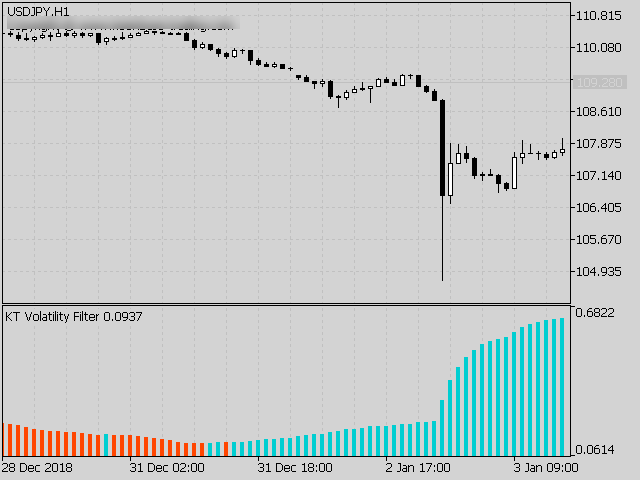
O Oscilador de Volatilidade KT analisa os dados de mercado passados e atuais utilizando uma fórmula matemática para exibir o resultado na forma de um oscilador. As ondas crescentes e decrescentes equivalem a alta e baixa volatilidade do ativo.
Em resumo, a volatilidade é simplesmente uma medida das flutuações de preço de um ativo ao longo de um determinado período de tempo. Sem volatilidade, haveria pouco movimento no mercado e os traders não poderiam lucrar com as variações de preço.
Uso da Volatilidade no Mercado Forex
O uso da volatilidade no mercado Forex pode te ajudar a operar de forma mais eficiente e a alinhar melhor as expectativas com a realidade.
Alta Volatilidade
- Sistemas baseados em tendência funcionam muito bem em mercados voláteis devido aos grandes movimentos e à manutenção de posições por mais tempo até que ocorra uma reversão de tendência.
- Sistemas de rompimento podem capturar mais pips do mercado se o rompimento ocorrer durante períodos de alta volatilidade.
Baixa Volatilidade
- Sistemas de reversão à média funcionam melhor em baixa volatilidade devido à tendência do mercado de retornar à média.
- Sistemas baseados em canais apresentam melhor desempenho durante os períodos de consolidação em baixa volatilidade.
Indicador Não Direcional
O Oscilador de Volatilidade KT é um indicador não direcional, o que significa que ele não está correlacionado diretamente com movimentos de alta ou baixa do mercado. O aumento da volatilidade pode ocorrer tanto em mercados de alta quanto de baixa.
Parâmetros de Entrada
- Período de Volatilidade: Um valor inteiro para definir o período de cálculo.
- Informações de Texto: Mostrar/ocultar informações no gráfico.
- ----- Configurações de Alertas -----
- Alerta Sonoro: true/false
- Alerta em Caixa de Diálogo: true/false
- Alerta por E-mail: true/false
- Notificações Push: true/false

O usuário não deixou nenhum comentário para sua avaliação