KT Volatility Oscillator MT5
- Индикаторы
-
KEENBASE SOFTWARE SOLUTIONS
 Keenbase Trading разрабатывает профессиональные индикаторы и советники (Expert Advisors) для MetaTrader 4 и MetaTrader 5, помогая трейдерам принимать более взвешенные торговые решения.
 - Версия: 1.2
- Обновлено: 26 марта 2022
- Активации: 5
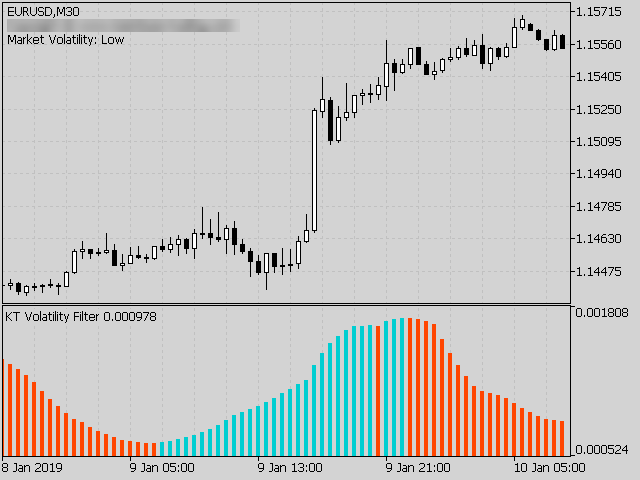
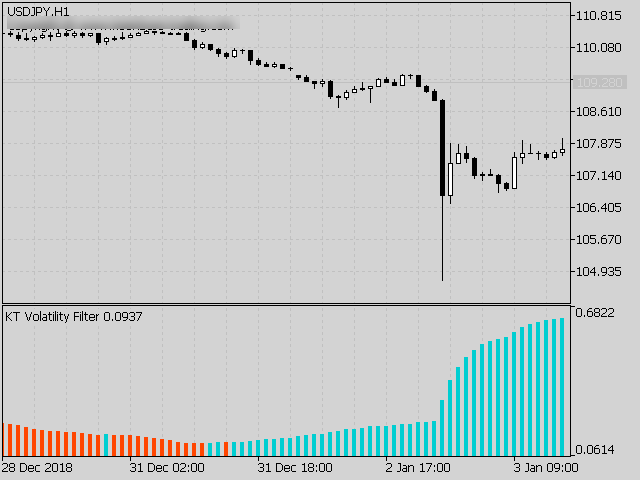
Осциллятор волатильности KT анализирует прошлые и текущие рыночные данные с помощью математической формулы, отображая результат в виде осциллятора. Растущие и снижающиеся волны соответствуют высокой и низкой волатильности актива.
Проще говоря, волатильность — это измерение колебаний цены актива за определённый период времени. Без волатильности на рынке было бы мало движения, и трейдеры не могли бы зарабатывать на изменениях цен.
Использование волатильности на рынке Форекс
Использование волатильности на рынке Форекс помогает торговать более эффективно и соотносить ожидания с реальностью.
Высокая волатильность
- Трендовые системы отлично работают на волатильных рынках благодаря большим колебаниям и более длительным позициям до изменения тренда.
- Системы на прорывах могут приносить больше пунктов, если прорыв происходит при высокой волатильности.
Низкая волатильность
- Системы возврата к среднему работают особенно хорошо при низкой волатильности благодаря свойству рынка возвращаться к средней цене.
- Системы, основанные на каналах, более эффективны в период консолидации при низкой волатильности.
Недирекционный индикатор
KT Volatility Oscillator является недирекционным индикатором, который не связан с бычьей или медвежьей направленностью рынка. Рост волатильности может сопровождать как бычий, так и медвежий рынок.
Входные параметры
- Период волатильности: Целое число для определения периода расчёта.
- Текстовая информация: Показать/скрыть текстовую информацию на графике.
- ----- Настройки оповещений -----
- Звуковое оповещение: true/false
- Оповещение через окно: true/false
- Оповещение по электронной почте: true/false
- Push-уведомления: true/false

Пользователь не оставил комментарий к оценке