Volume Bands Chart
- Indikatoren
- Version: 1.0
- Aktivierungen: 5

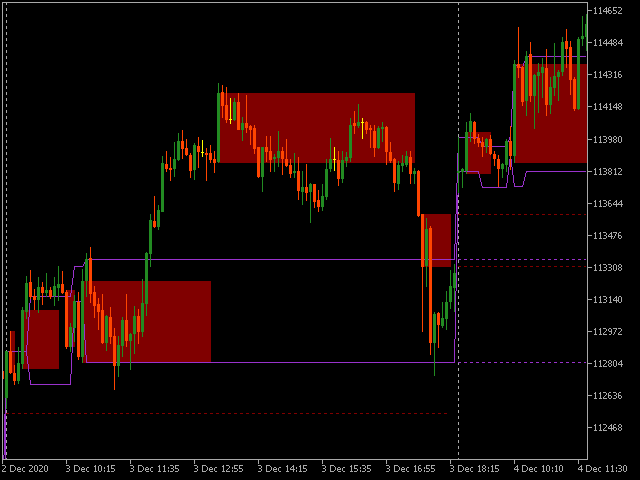
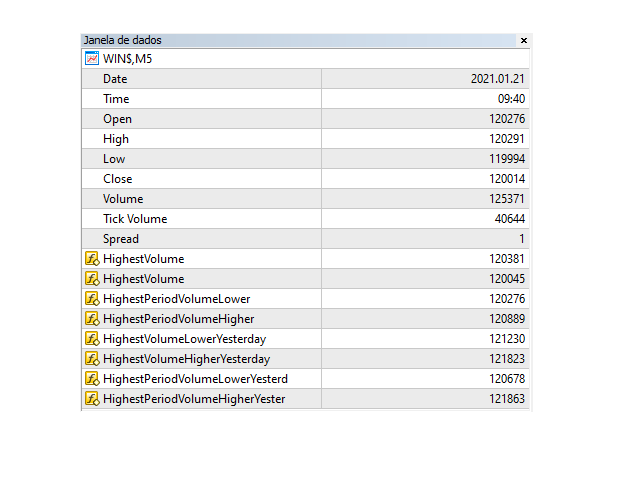
Dieser Indikator markiert die relevanten Volumenniveaus im Tagesverlauf. Die beiden relevanten Niveaus sind die Kerze mit dem größten Volumen und der Zeitraum mit dem größten Volumen an gehandelten Lots.
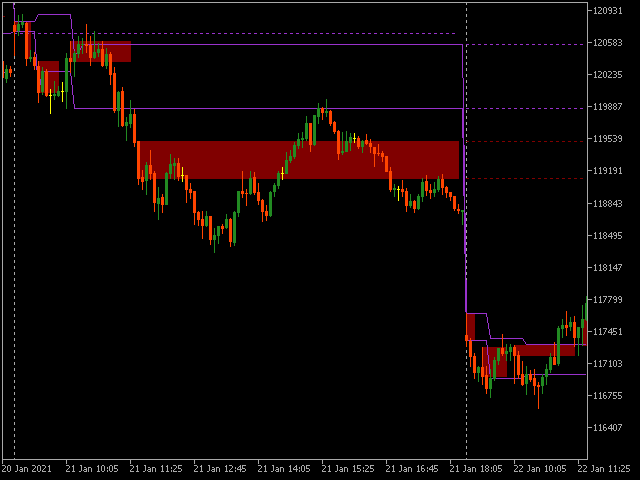
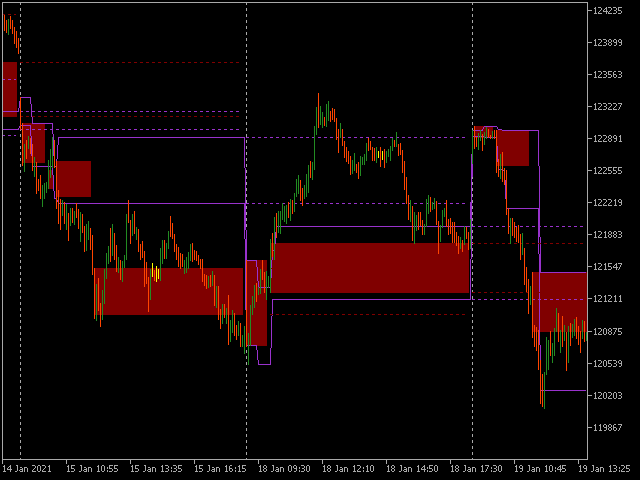
Der gefüllte rote Hintergrund ist der Bereich des Preises mit dem größten Volumen des Tages (wahrscheinlich der große Spieler, der das Spiel beherrscht). Die violetten Linien zeigen den Preisbereich mit dem größten Volumen (wahrscheinlich ein Bereich, in dem ein großer Akteur akkumuliert, bevor er eine Marktrichtung erzwingt). Die gepunkteten Linien markieren auch die Volumenbereiche des Vortages.
Sie können feststellen, dass die vom Indikator markierten Volumenniveaus zu Unterstützungs-/Widerstandsbereichen werden, auch ohne Spitzen/Täler, die die grafische Analyse normalerweise verwendet.
Für EA-Programmierer: Dieser Indikator wird nicht neu gezeichnet. Er kann sicher mit EAs verwendet werden.