Utilities
- Indikatoren
-
Douglas Lucio De Araujo
 Simple, turn your Trading System into an indicator.
 - Version: 1.0
- Aktivierungen: 5
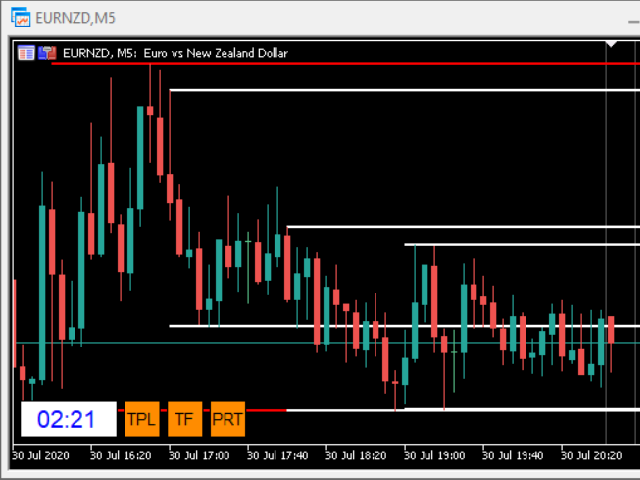
Anzeiger mit 3 Funktionen
- Uhr: Uhr unabhängig vom Chart, Zählung läuft weiter, auch wenn der Markt geschlossen ist.
- Vorlage: Nach dem Einrichten einer Konfiguration in einer beliebigen Grafik, sei es Farbmuster, Indikatoren, Zoom ... Die Konfiguration wird in alle aktiven Grafiken kopiert.
- Zeitrahmen: Legen Sie den TimeFrame für eine Grafik fest, und mit nur einem Klick werden alle aktiven Grafiken auf denselben TimeFrame umgestellt.