Fibonacci Ribbon
- Indikatoren
- Version: 2.44
- Aktualisiert: 23 März 2020
- Aktivierungen: 5

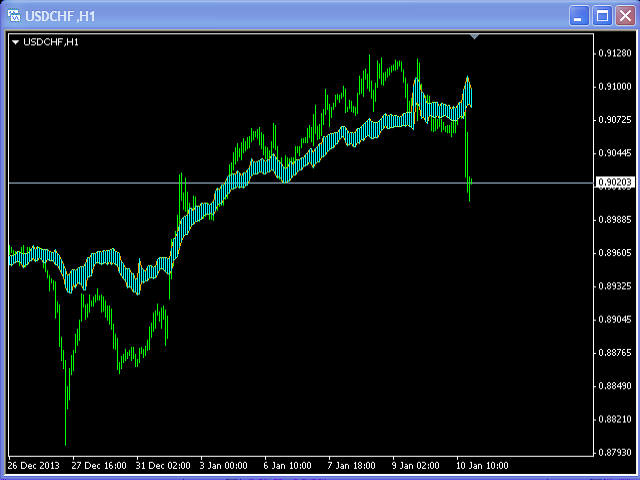
Dieser Indikator basiert auf der Fibonacci-Folge.
Der Eingabeparameter fiboNum ist für die Nummer in der Integer-Sequenz verantwortlich. Der Eingabeparameter counted_bars bestimmt, bei wie vielen Balken die Linien des Indikators sichtbar sind.
Wenn der vorherige Schlusskurs über dem vorherigen Balken des Indikators liegt, ist die Wahrscheinlichkeit, dass der Indikator Long geht, sehr hoch.
Wenn der vorherige Schlusskurs unter dem vorherigen Balken des Indikators liegt, ist die Wahrscheinlichkeit sehr hoch, short zu gehen.