Fibonacci Ribbon
- Indicadores
- Versión: 2.44
- Actualizado: 23 marzo 2020
- Activaciones: 5

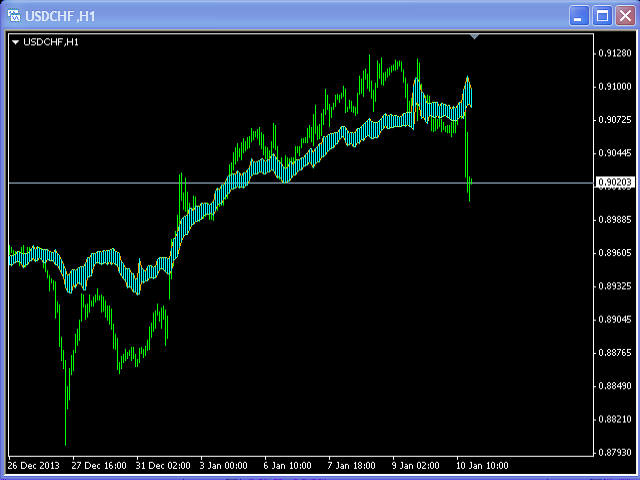
Este indicador se basa en la secuencia de Fibonacci.
Los parámetros de entrada fiboNum es responsable del número en la secuencia de enteros. El parámetro de entrada counted_bars determina en cuántas barras serán visibles las líneas del indicador.
Cuando el precio de cierre anterior está por encima de la barra anterior del indicador, la probabilidad de ir en largo es muy alta.
Cuando el precio de cierre anterior está por debajo de la barra anterior del indicador, la probabilidad de ir en corto es muy alta.