DBS Delta
- Indikatoren
- Version: 2.10
- Aktivierungen: 5

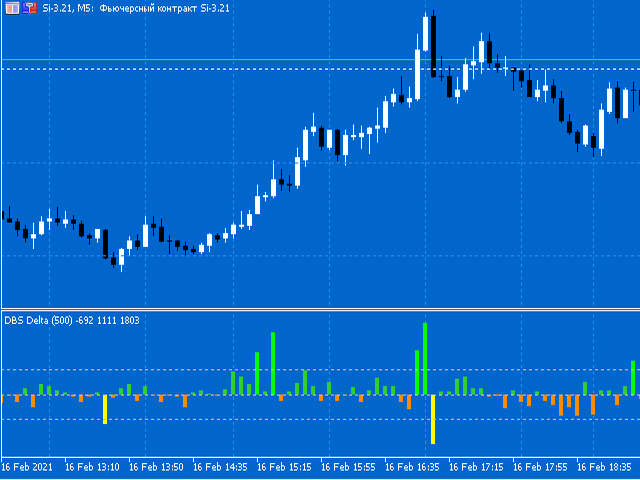
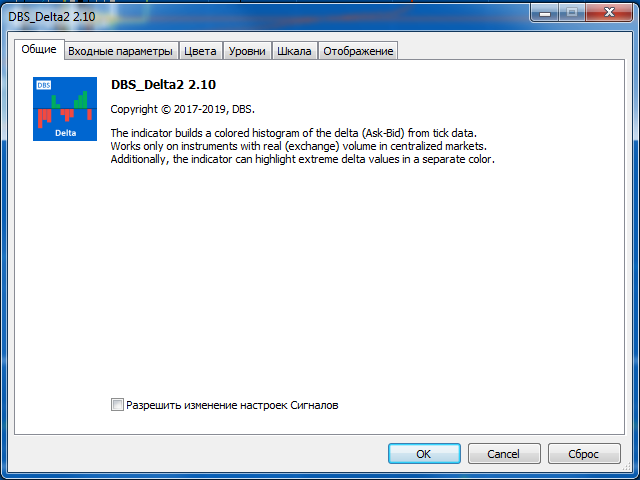
Der Delta-Indikator wird verwendet, um die Differenz zwischen dem Volumen, das an der Börse zum Ask-Kurs und darüber (Marktkäufe) und dem Volumen, das zum Bid-Kurs und darunter (Marktverkäufe) gehandelt wurde, anzuzeigen. Dieser Indikator zeigt das Delta jeder Kerze auf dem Zeitrahmen Ihrer Wahl an.
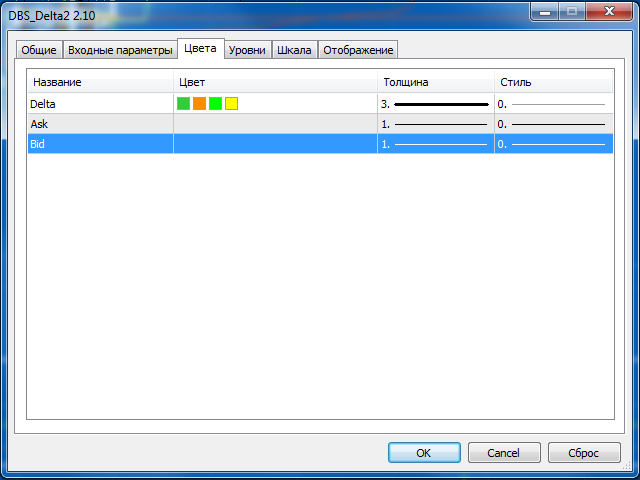
Die Daten werden als farbiges Histogramm in einem separaten Indikatorfenster angezeigt.
Der Indikator wird aus der Tick-Historie berechnet. Um die Berechnungen zu beschleunigen und die Belastung des Systems zu verringern, wird die Anzahl der zu berechnenden Balken in den Parametern angegeben.
Außerdem kann der Indikator die Werte, die das in den Einstellungen angegebene Niveau überschreiten, mit einer zusätzlichen Farbe hervorheben.
ACHTUNG! FÜR DEN BETRIEB DES INDIKATORS SIND TICK-HISTORY-DATEN UND REALE BÖRSENVOLUMINA ERFORDERLICH! DER INDIKATOR FUNKTIONIERT NUR BEI BÖRSENINSTRUMENTEN!
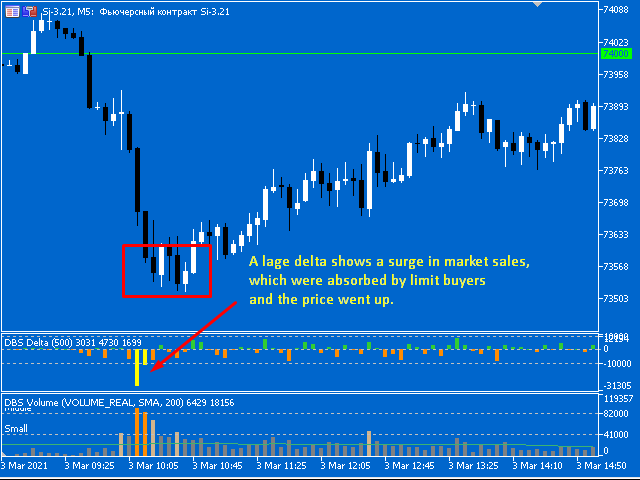
Das allgemeine Wesen des Indikators besteht darin, dass das Delta den "Charakter" des Marktes bestimmt, d.h. das Vorherrschen von Marktkäufern oder -verkäufern im Moment. Zusammen mit dem Volumenindikator an der Stelle von Volumenspitzen ist es auch wichtig, einen anormalen Delta-Spike zu berücksichtigen - in der Regel ist dies ein Zeichen für das Ende des Trends (an seinem Ende) oder für einen starken Impuls für eine neue Bewegung (an seinem Anfang). Vergessen Sie auch nicht, das Delta in einem Trend zu analysieren (d.h. sein Verhalten über mehrere Bars).